
Cloud Cover Percentage from Visible Satellite Data
In order to estimate percentage of cloud cover for a given month over a given area, a visible channel threshold method as described in Reinke, et al (1992) was used.
First, a set of GOES Visible (channel 1) images for a given month and hour over a given sector are quality checked for noise lines or other problems. Then for each pixel location within the sector, all the images in the set are compared and the minimum value (excluding values within suspected cloud shadow regions) is found. The results form a cloud-free image called a background. For example, figure 1 was created by taking the 1845 UTC visible images over the GOES-8 conus sector for the month of May, 1999.
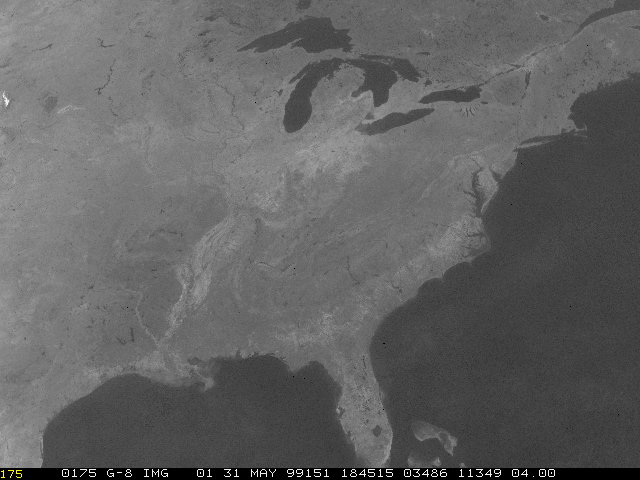
figure 1
The varying brightness values of this image are due to the solar angle and the terrain features. While water bodies such as rivers and lakes tend to be darker than land, the land itself has a range of values due to different slopes, soil and vegetation types. Even the shallower water around the coast lines and islands are noticeably lighter than the surrounding ocean. It is due to these differences that a background is created, to provide the algorithm what values to expect for clear conditions and thus be able to better detect abnormally bright (i.e. clouds) values.
The background is then used to compare against each image within the set used to create it. For each pixel location, the image value is compared to the corresponding background plus a given threshold value. If the image value is greater than the background and threshold, that pixel is tagged as cloudy. If the image value is less, it is considered clear.

figure 2
For example, figure 2 is a GOES-8 conus sector visible image for May 2, 1999 at 1845 UTC. It was one of the visible images used to create figure 1. In it a variety of clouds can be seen, from the low pressure system in the plains to the small cumulus popping up in Pennsylvania and New York State.

figure 3
By comparing this image to the background plus a threshold count value of 35, the cloud/no cloud image in figure 3 is created. Areas that are white are tagged as cloud. Black areas are clear. When visually comparing figure 2 with figure 3, it can be seen that most of the clouds have been identified by this method.
As the images from the set are processed, the number of cloudy pixels for each pixel location are tallied. Then the number of cloudy pixels is divided by the total number of pixels for that location to produce a cloud percentage. An example for May 1999, 1845 UTC is figure 4.

figure 4
While this product does detect a majority of the clouds, there are some problem areas. Since this method relies on the background being significantly darker than the cloud, light color ground surfaces can reduce the ability to detect clouds. While the brightest clouds can be detected over desert sand, salt flats, and a constant snow cover, darker clouds may be missed and thus erroneously lower the cloud percentage over these areas. In addition, the variable nature of snow cover during the winter and in the mountains can cause false detection. Since snow is lighter than the same ground surface without snow, the clear ground will be used in the background. Thus, if that area is snow-covered at some point during the month, it can be falsely counted as cloud. Over such areas, cloud percentages should only be considered a rough estimation. Thankfully, the pixels effected by variable snow cover tends to be a small percentage compare to the whole image.
There are also some clouds types that the visible channel misses, such as thin cirrus. Nor does this method attempt to identify cloud types or assign cloud heights. To answer these questions, we would like to eventually include more cloud products, incorporating other channels such as 2 and 4 with the additional information that can be gained. Additional channels would also be helpful in improving cloud detection over problem areas such as bright sand. Eventually, we hope to combine these algorithms into a multichannel cloud product.
Reference:
Reinke, D.L., C.L. Combs, S.Q. Kidder, and T.H. Vonder Haar, 1992: Satellite cloud composite climatologies: A new high-resolution tool in Atmospheric research and Forecasting. Bull. Amer. Meteor. Soc. 73, 278 - 285.