|
|---|
| RAMMB CIRA 4th Quarter Report |
July August September |
Tropical Cyclone Product Development![]()
A formal evaluation of the Western N. Pacific sub-domain of the new Tropical Cyclone Formation Probability Product (TCFP) began on Aug. 27, 2007 at the Joint Typhoon Warning Center (JTWC) in Pearl Harbor, HI. Formal evaluation will continue through the end of the 2007 tropical cyclone season, at which time both quantitative and qualitative feedback will be provided by JTWC forecasters. JTWC is one of the primary users for which the new TCFP product was developed, and their feedback will be useful in optimizing the experimental product before transition to operations. (A. Schumacher, M. DeMaria, J. Knaff)
|
|
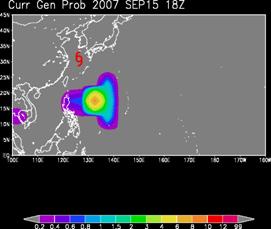
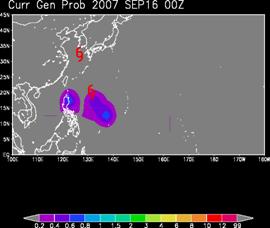
The new, extended Tropical Cyclone Formation Probability product showed a localized probability maximum on September 15, 2007, the day prior to the formation of Typhoon Wipha near 20° N, 131° E in the Western N. Pacific Basin.
Work continues on the objective identification of Annular Hurricanes. Most recently, a manuscript discussing the development of an annular hurricane index was accepted for publication in Weather and Forecasting. Annular hurricanes are a subset of intense tropical cyclones that have been shown in previous work to be significantly stronger, to maintain their peak intensities longer, and to weaken more slowly, than average tropical cyclones. Because of these characteristics, they represent a significant forecasting challenge. This paper updates the list of annular hurricanes to encompass the years 1995-2006 in both the North Atlantic and eastern/central North Pacific tropical cyclone basins (as shown in Figure 1) However, since the occurrence of annular hurricanes is rare (~4% of all hurricanes), a special algorithm to detect annular hurricanes is developed that employs two steps to identify the candidates: 1) prescreening the data and 2) applying a linear discriminant analysis. Independent results suggest that the algorithm will be able to detect ~96% of the annular hurricane cases with a false alarm rate of ~6%. The algorithm is being run in real time at NHC in conjunction with the Statistical Hurricane Intensity Prediction Scheme during the 2007 hurricane season. (J. Knaff, M. DeMaria, A. Schumacher)

Figure 1. Color enhanced GOES infrared satellite imagery of the fourteen annular hurricane cases at or near peak visual annular characteristics. Storm names, dates and times are given at the bottom of each individual image panel. In addition, storm names and year are listed below each image panel.
Two-dimensional output of the recently developed multi-platform satellite-only tropical cyclone surface wind analysis (Sat-only TC winds) was compared to the NOAA/AOML H-Wind surface wind analyses for all the co-occurring cases during the 2006 hurricane season. H-wind analyses make use of high-density cloud-drift winds, QuikScat ocean wind vectors, Aircraft reconnaissance wind data either at flight-level or at the surface (from the stepped frequency microwave radiometer), Ships, and Buoys. The Sat-only TC winds are created by combining information from AMSU-based 2-d winds (Bessho et al. 2006), Cloud/Feature track winds from NESDIS, IR-based winds near the TC center (Mueller et al. 2006) and QuikScat surface wind vectors, which is explained in Knaff and DeMaria (2006). There were 63 cases from six Atlantic tropical cyclones and three East Pacific tropical cyclones. Results, shown in Fig. 2 and Fig. 3, are very encouraging in that the largest mean absolute errors were on the order of 8 m/s with the overall errors being less than 3 m/s and biases were -0.3 m/s. Largest errors are near the tropical cyclone center and were primarily caused by 1) misplacing the radius of maximum winds, 2) the H-Wind rarely having maximum winds that agreed with the NHC advisory at the same time. Six-hourly analyses of global tropical storms starting in 2007 and all active tropical cyclones are available at http://rammb.cira.colostate.edu/products/tc_realtime/. Wind radii information resulting from these analyses is also being supplied in real-time to NOAA/TPC and DOD/JTWC. (J. Knaff)
Click on image to enlarge.
Figure 2: Mean absolute error results of a 63 case evaluation comparing the Sat-only TC winds to the H-Wind analyses for co-occurring times. Horizontal scales are given in units of km and the errors are contoured in units of m/s.
Click on image to enlarge.
Figure 3: Bias results of a 63 case evaluation comparing the Sat-only TC winds to the H-Wind analyses for co-occurring times. Horizontal scales are given in units of km and the biases are contoured in units of m/s.
The RAMMB real-time tropical cyclone web page was updated. Two new products, a storm relative visible image loop and a satellite-based kinetic energy versus intensity category comparison, were added to the page. An example of the storm-relative visible image and corresponding KE product for Hurricane Felix (2007) are shown in Fig. 4. The web page was also updated to include “invest” or areas under investigation for tropical cyclone formation at the request of forecasters at JTWC. Several of the products including the surface wind product and the AMSU products have been found useful for monitoring TC development. Further information on these and the other products available at this site can be found at http://rammb.cira.colostate.edu/products/tc_realtime/about.asp. (J. Knaff, K. Micke)
 \
\
Click on images to enlarge
Figure 4: Examples of new products added to the RAMMB Tropical Cyclone Web Page. Shown are the storm-relative visible image sector and corresponding Kinetic Energy vs. Intensity product for Hurricane Felix valid 3 September 2007 at ~12UTC. Note on the web page both figures are animated.
A manuscript entitled “Experiments with a Simple Tropical Cyclone Intensity Consensus” by C. Sampson (NRL), J. Franklin (NCEP/TPC), J. Knaff and M. DeMaria was accepted for publication in Weather and Forecasting. This study conducts experiments with intensity forecast aids on four years of data (2003-2006). Findings suggest that simple equally-weighted ensembles of skillful and/or independent forecast models result in a reduction of intensity forecasting errors. The findings also demonstrated that forming a consensus from skillful members was not sufficient to reduce the consensus mean error. The members must also demonstrate independence from each other. (J. Knaff)
For several years, GFS data have been ingested and converted from grib1 format to a packed ASCII format for use in tropical research. Because of the upcoming switch to grib2 format, portions of the conversion code have been rewritten to process the new format. The testing of the new code is underway. (J. Dostalek)
![]()