

![]()

![]()
Ocean heat content information is being used to produce forecasts of typhoon intensity at the Naval Research Laboratory, Monterey. Real-time heat content information is provided to NRL by G. Goni of the NOAA/AOML. This information is used in a recently developed version of the Statistical Typhoon Intensity Prediction Scheme that makes use of such information in the western North Pacific. Forecasts are produced in real time and are disseminated to the Joint Typhoon Warning Center for use in their forecasting duties. Result will be verified and compared at the end of the 2005 Typhoon Season. Figure 1 shows the expected improvement associate with the addition of ocean heat content to STIPS. 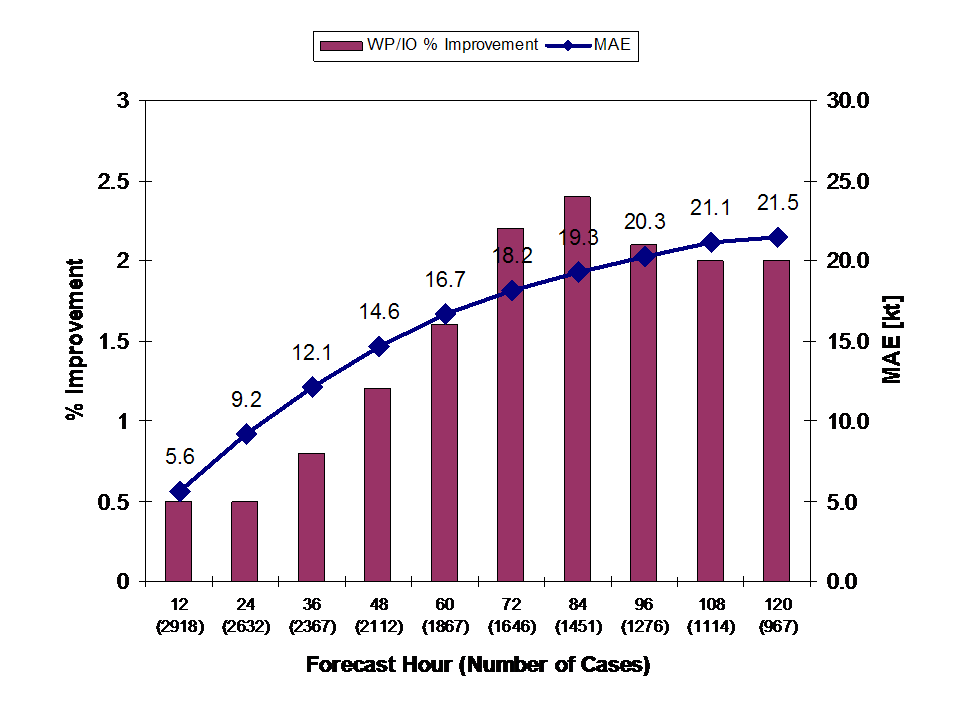
Figure 1. Mean absolute forecast errors (kt) and percent improvement over the previous version of the STIPS model associated with a similar model that takes into account the variation of the ocean heat content along the forecast track. Errors and improvements are based on dependent data.
Work continues on a satellite-only tropical cyclone surface wind analysis. This work combines in a specially developed objective analysis (cylindrical, variational) observations from feature tracked winds, SSMI winds, QuickScat winds, AMSU-derived 2-d wind fields, and IR-derived winds. The key ingredient is the recent development of an IR method to predict the winds associated with the core of the tropical cyclone using two pieces of information predicted from the IR imagery (size and radius of maximum winds) and other information provided from the tropical cyclone advisories (intensity, motion, and location). The combined analyses are run in real-time while the analysis is improved. The current version uses a standard flight-level to surface wind correction over water, and decreases (turns) these winds an additional 20% (20 degrees) over land. Examples are shown for the currently occurring tropical cyclones in Fig. 2.
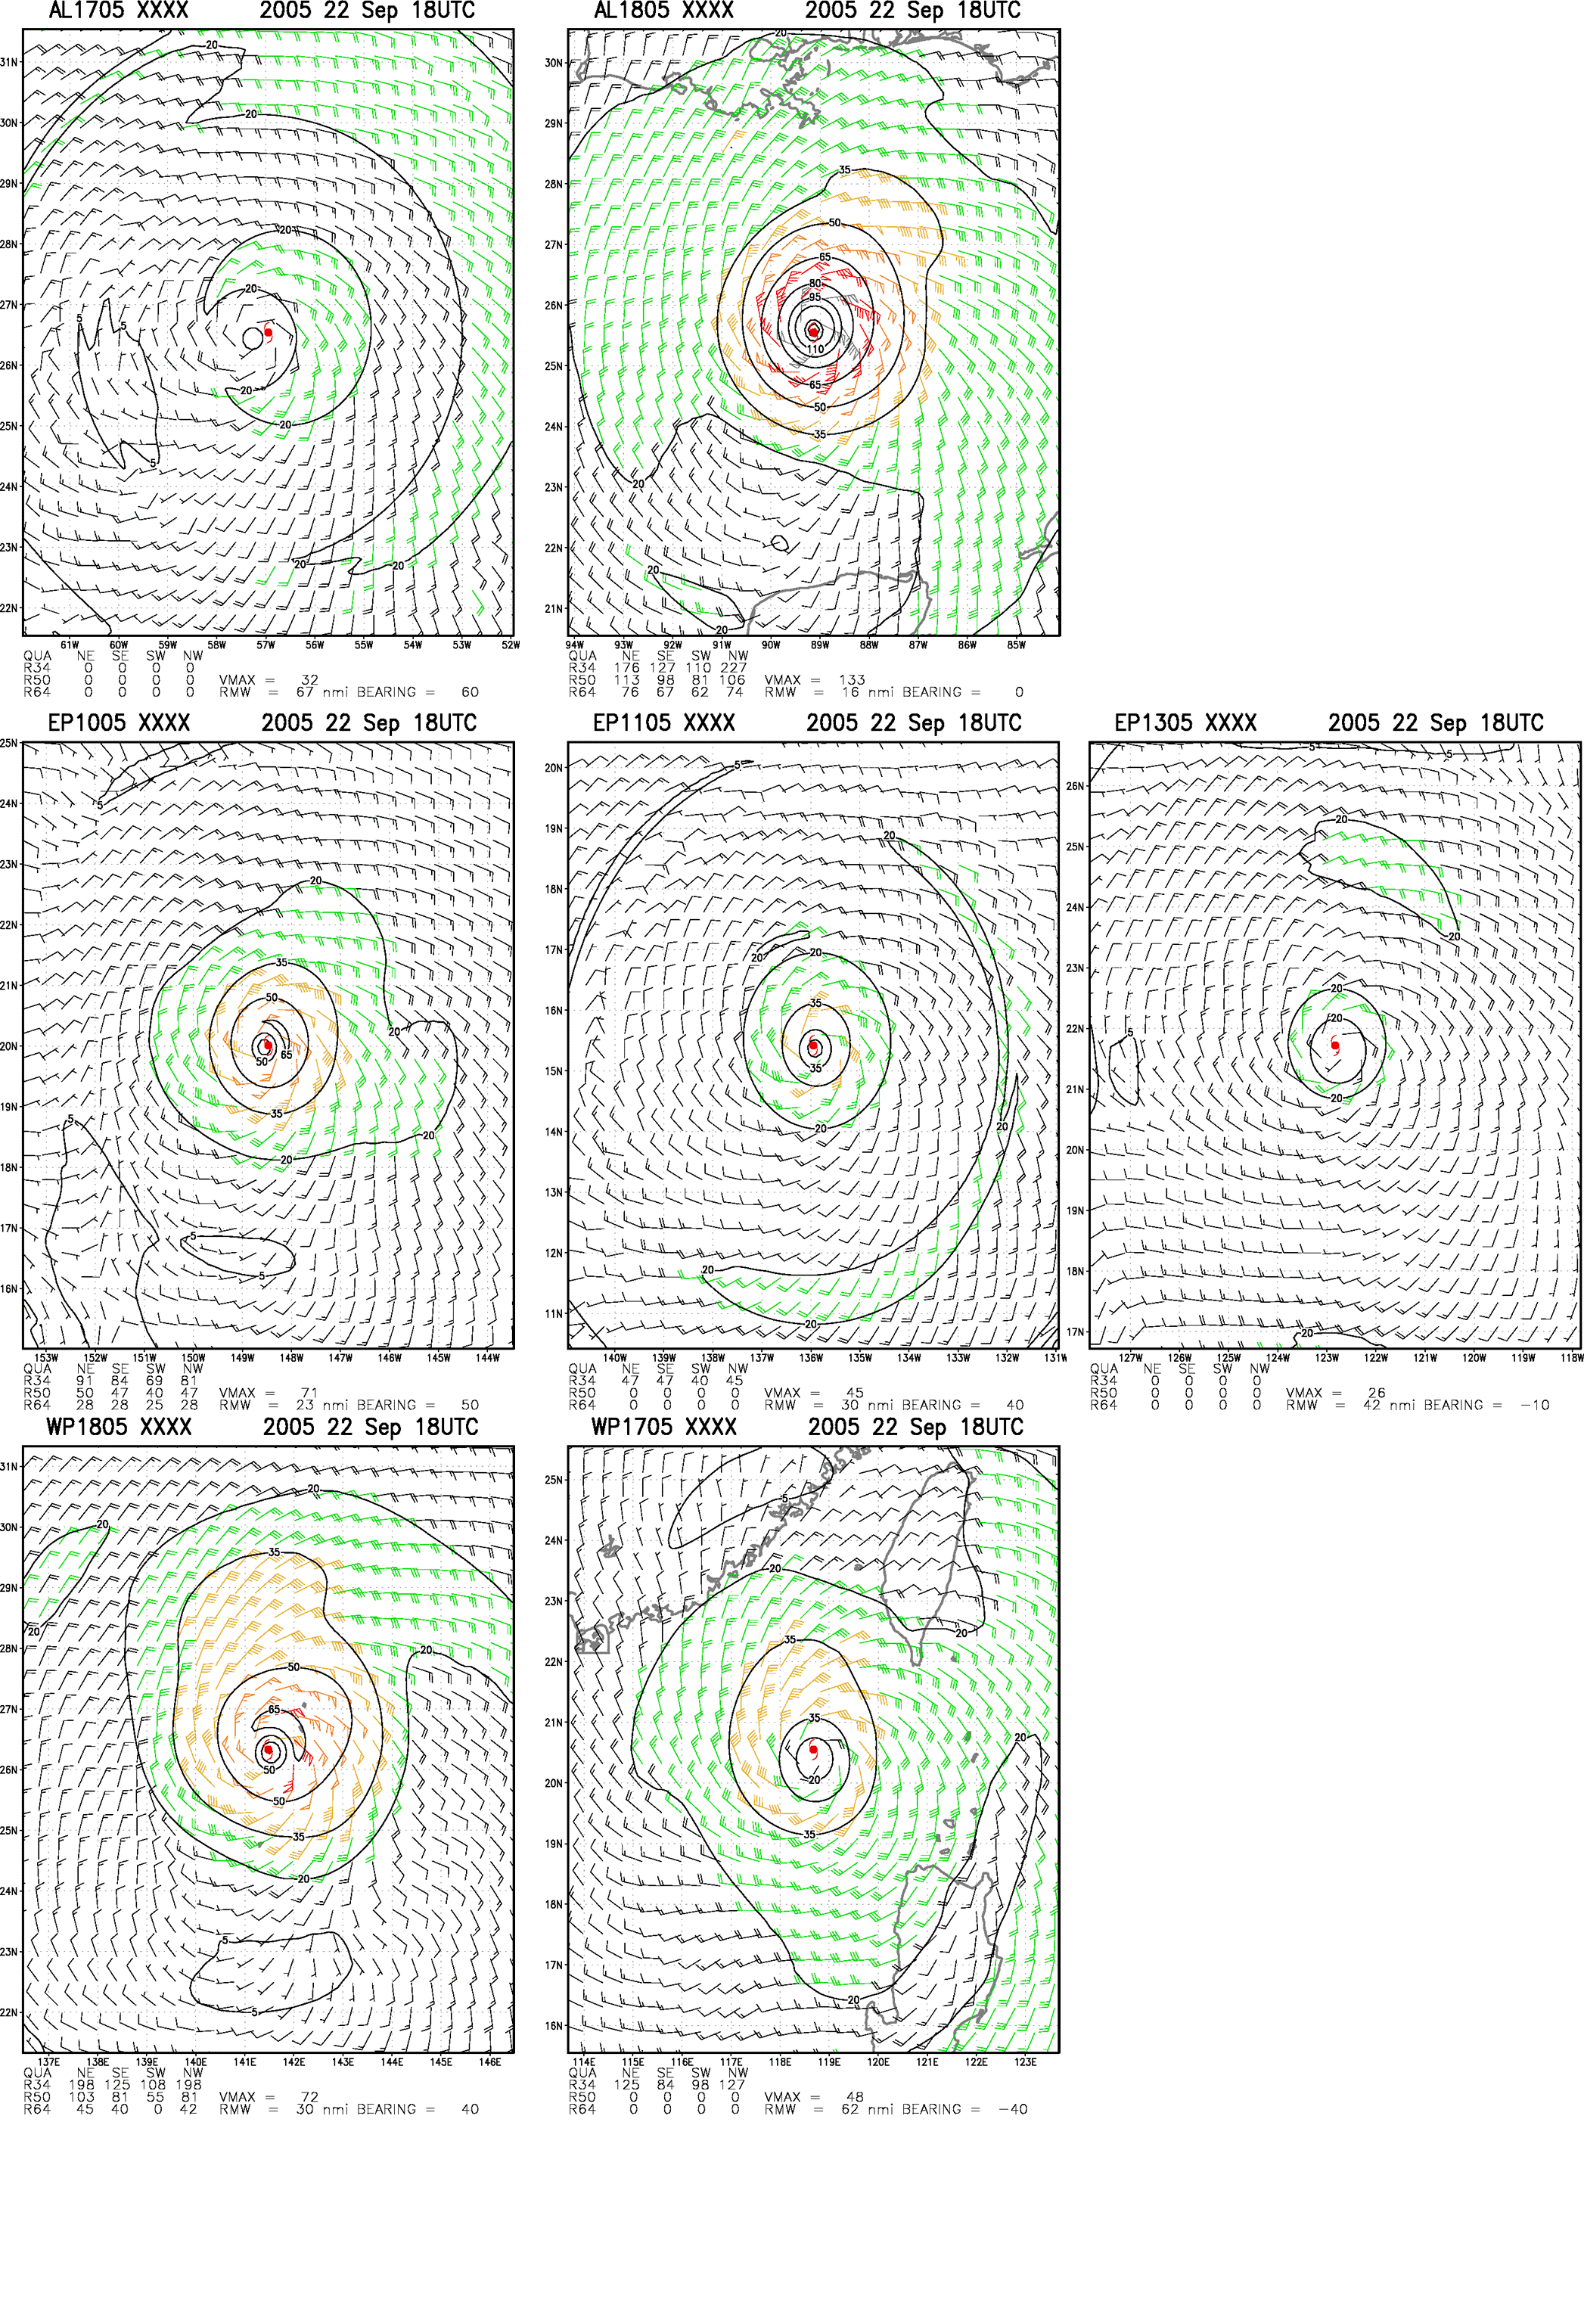
Figure 2. Real-time satellite only tropical cyclone surface wind analyses created 18 UTC 22 September 2005 of all active tropical cyclones based on National Hurricane Center, Central Pacific Hurricane Center, and Joint Typhoon Warning Center Advisories. Atlantic storms Tropical Storm Philippe (AL17), Hurricane Rita (AL18) are at the top, East Pacific storms Hurricane Jova (EP10), Tropical Storm Kenneth (EP11) and Tropical Depression Max (EP13) are in the middle and West Pacific Storms Tropical Storm Damrey (WP17) and Typhoon Saola (WP18) are shown at the bottom.
The pressure vs. wind relationships for tropical cyclones have been re-evaluated using the last 15 years of tropical cyclone best track wind estimates and aircraft MSLP values to assess the relative importance of latitude, environmental pressure and tropical cyclone size. Both environmental pressure and tropical cyclone size are determined from numerical analyses and appear to have no dependency on the analysis used (NOGAPS, GFS, and NCEP-Reanalysis). Findings suggest that all of these factors can be used to reduce the scatter in the current pressure wind relationships. Larger and higher latitude storms produce lower MSLP for the same maximum wind speed. Environmental pressure is additive, so that storms occurring in a higher pressure environment have higher MSLP. Relationships were developed to estimated the wind from quality pressure observations and to estimate the pressure given a good estimate of the maximum 10-m, 1-minute sustained wind. These relationships can be utilized in operational tropical cyclone centers throughout the world and for reanalysis of past tropical cyclone events. Figure 3a shows the estimates of maximum wind speed based on the observed MSLP using this new method vs. the best track wind speeds for the 2005 Atlantic Hurricane Season through 8 Sept 2005. For comparison, Fig. 3b shows the wind speed estimate based on the Atlantic Dvorak pressure wind relationship vs. the observed best track value. Note the Katrina best track used was preliminary. Documentation of these methods has been prepared for publication.
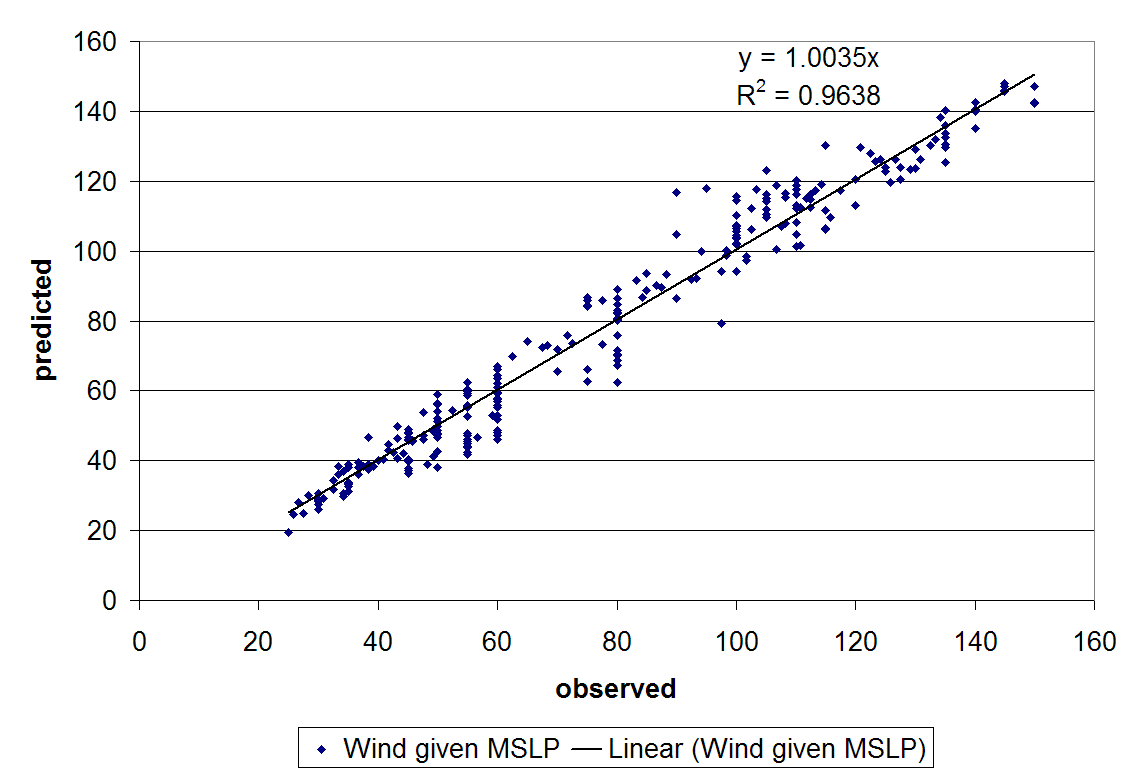
Figure 3a
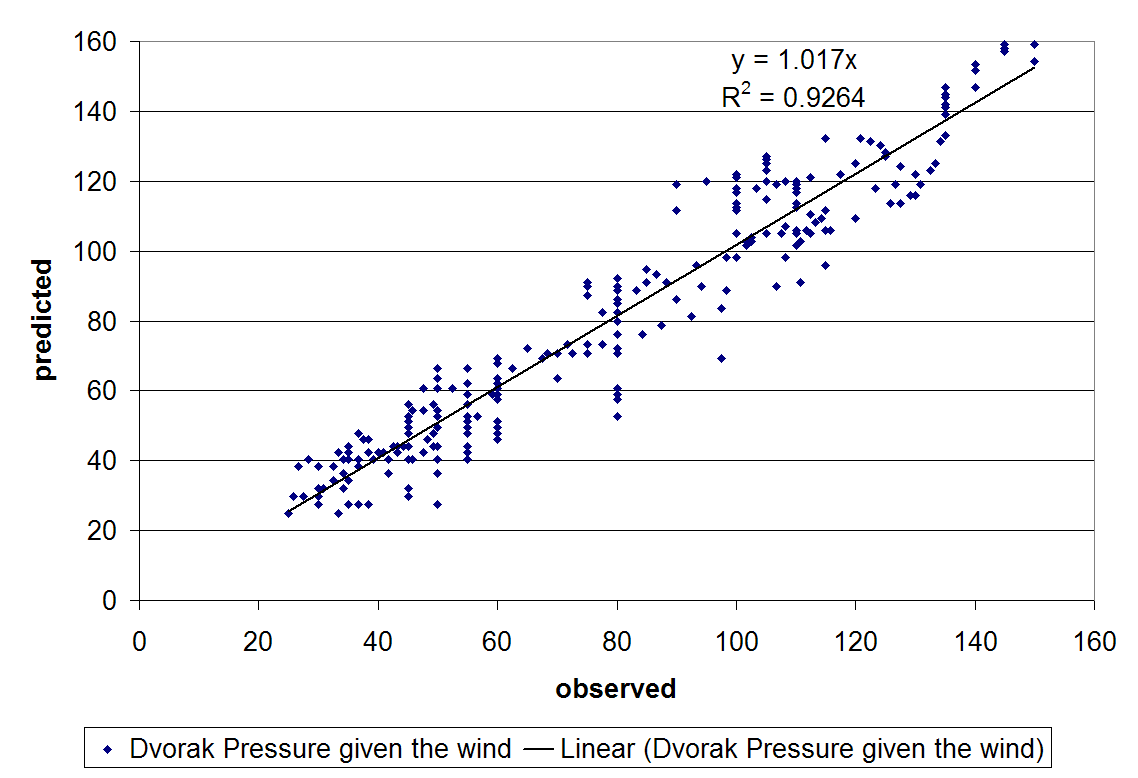
Figure 3b
Figure 3. Displayed is a comparison of tropical cyclone pressure vs. wind relationships. a) results of a recently developed relationship that given the MSLP predicts the maximum sustained wind given storm latitude, tropical cyclone size and environmental pressure. Cyclone size and environmental pressure are estimated from the NCEP GFS model. b) is the maximum wind predicted if the Atlantic Dvorak pressure vs. wind relationship is used given the MSLP. Pressures come from aircraft and dropsonde observations during the 2005 Atlantic Hurricane Season. Results are for independent cases.
A paper describing the statistical tropical cyclone wind radii prediction schemes used at the National Hurricane Center and the DOD Joint Typhoon Warning Center has been prepared for publication. Two models based on climatology and the persistence of initial conditions are described. One model makes use of a parametric vortex (DRCL) to make predictions while the other (MRCL) uses multiple linear regressions. Both produce remarkably similar results as shown in Figs. 4a,b for Tropical Storm Franklin on 23 July 2005 at 0000 UTC. The forecast intensities are listed on the figure at each forecast point valid for 0, 12, 24, 36, 48, and 72-h.
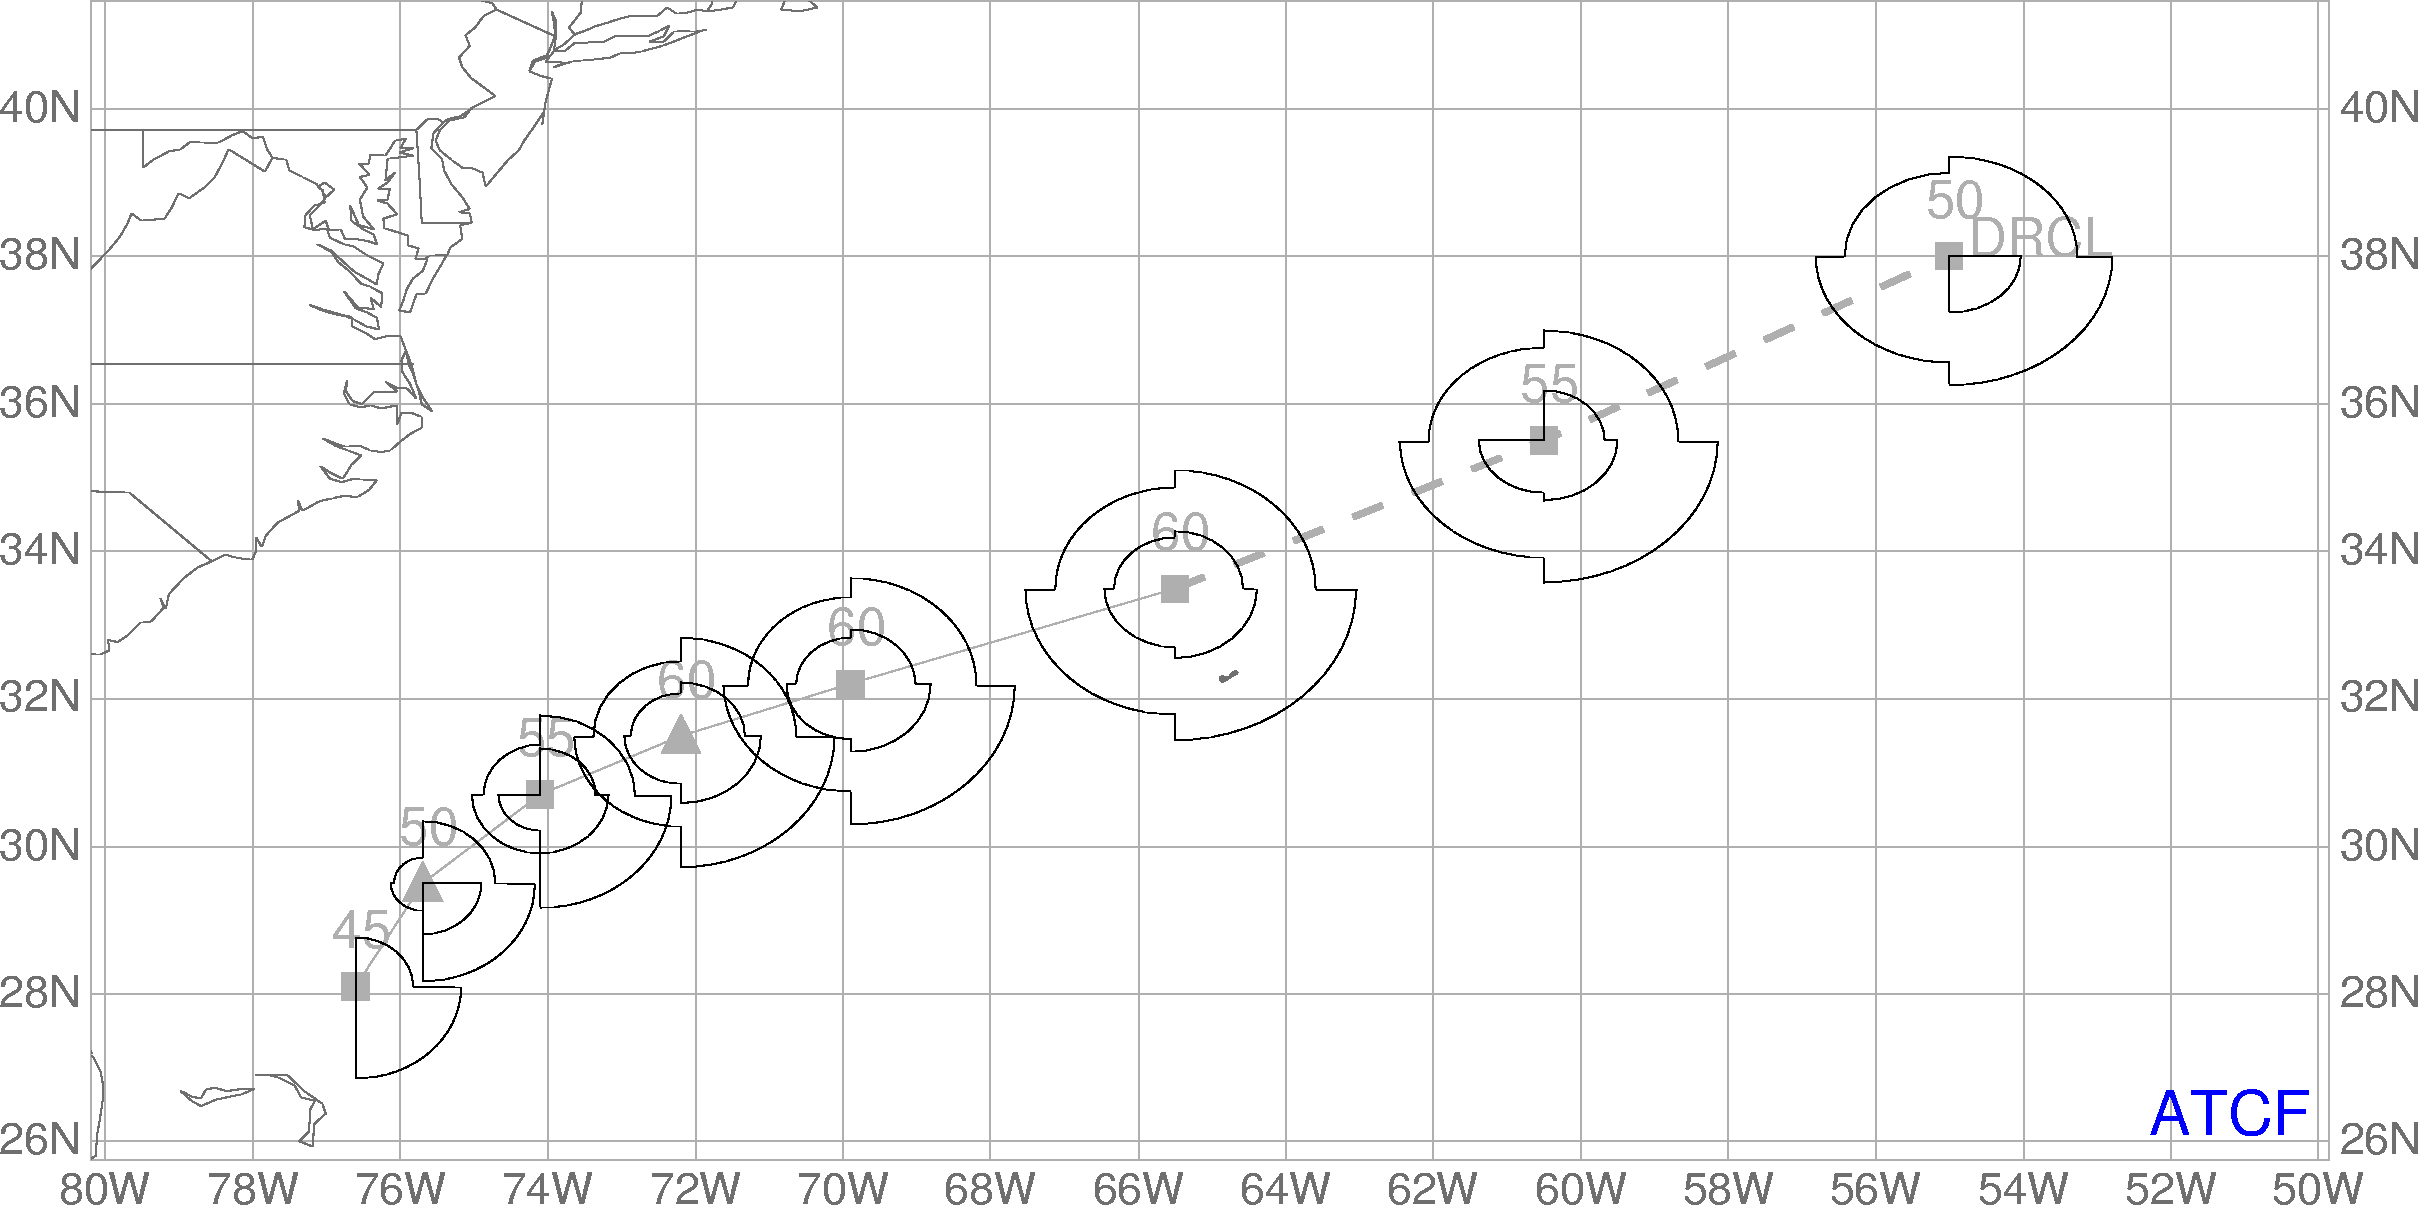
Figure 4a
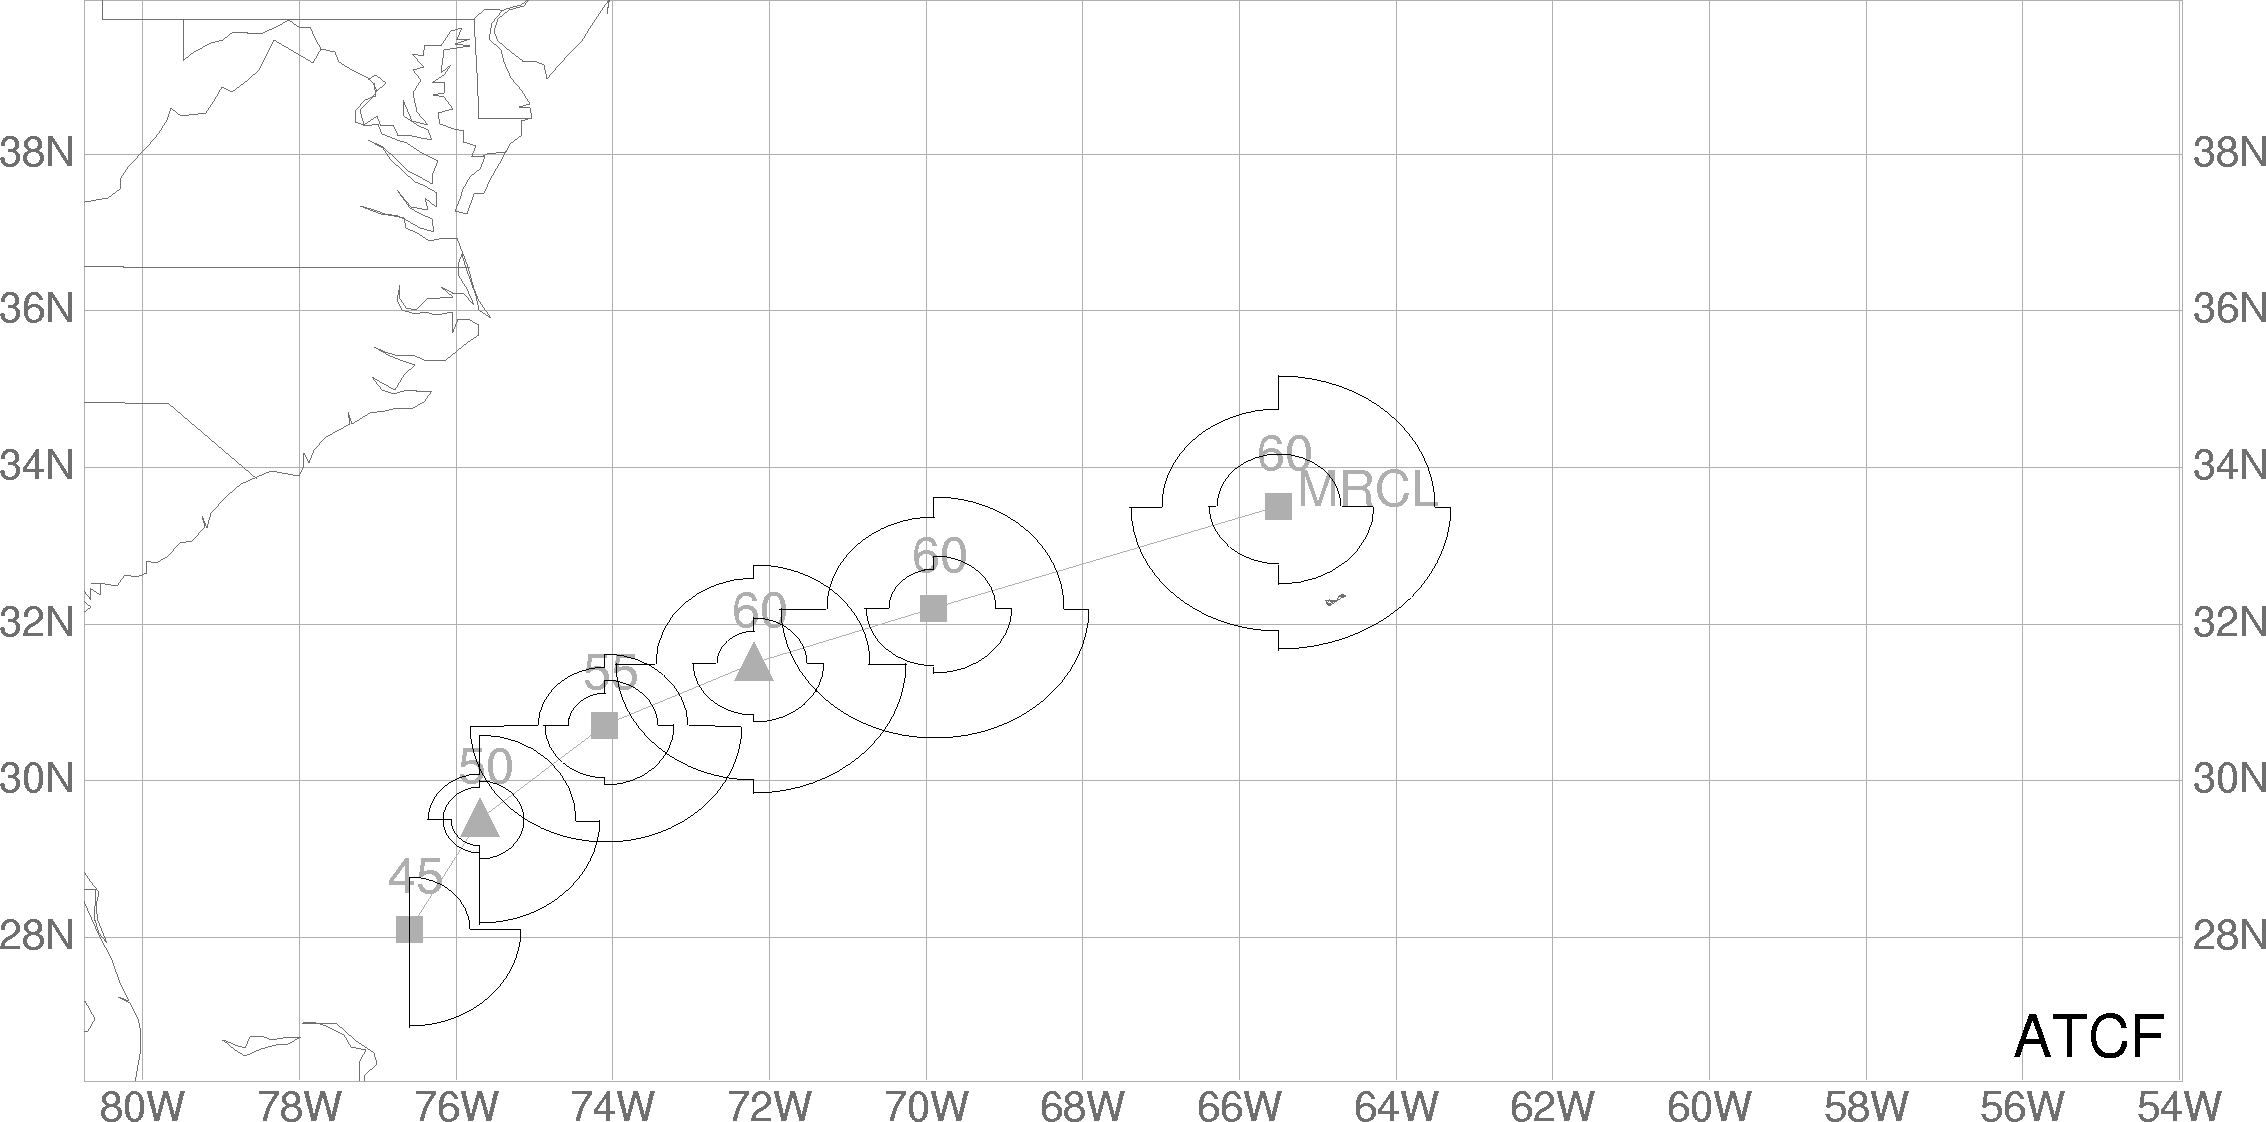
Figure 4b
Figure 4. Forecasts of tropical cyclone wind radii associated with tropical Storm Franklin on 23 July 2005 produced by purely statistical forecast schemes based on a combination of climatology and the persistence of initial conditions are shown. Part a) 5-day forecasts made by the DRCL model, and b) the 3-day forecast made by the MRCL model. In both cases initial 34-kt wind radii are 40, 75, 0 and 0 nm in the NE, SE, SW, and NW quadrants, respectively. See text for model descriptions.
In order to account for changes in grib data storage implemented by NESDIS, code which converts Global Forecast System (GFS) model analyses from grib format to a packed ASCII format was updated. The output of the code is used in a program which generates a tropical cyclone genesis parameter. If the NESDIS server experiences problems, code is available to retrieve the GFS data from the National Weather Service server.
A 10-day rotating archive of McIDAS GRID files, containing selected fields from Global Forecast System (GFS) model analyses, has been created at RAMMB-CIRA. The files are being used for tropical cyclone research.
![]()
Return to the current RAMM Team Quarterly Report
RAMM/CIRA 4th Quarter Report