Hamsu1.gif: The locations of the AMSU data and position of Hurricane Adrian on 06/20/99 at 14 UTC.
Hamsu2.gif: The surface pressure field for Hurricane Adrian on 06/20/99
at 14 UTC estimated from AMSU observations.
DeMaria, Zehr, Hilgendorf, Knaff, Connell, Phillips
Four basic products are produced for each storm for which AMSU data
are available. Examples of these products for hurricane Adrian are
shown below. The four products include the data swath (Hamsu1.gif) which
shows the locations of the AMSU data relative to the storm center, the
surface pressure (Hamsu2.gif), a radial-height cross section of the azimuthally
averaged temperature anomaly (Hamsu3.gif), and a radial-height cross
section of the azimuthally average gradient wind (Hamsu4.gif). The resolution
of the AMSU data varies from about 50 km near nadir, to about 130 km near
the limb of the scan. Because hurricane Adrian was near the limb,
the algorithm failed to resolve the storm core. The storm had maximum
winds of about 80 kt at the time of the AMSU pass, but the analysis only
indicated winds of about 30 kt. However, the analysis can still provide
useful information about the vertical and horizontal structure of the storm.
For example, in the case of Adrian, the AMSU analysis showed that the cyclonic
circulation extended through a very deep layer, and the maximum warm anomaly
occurred at a fairly high level.
|
Hamsu1.gif: The locations of the AMSU data and position of Hurricane Adrian on 06/20/99 at 14 UTC. |
Hamsu2.gif: The surface pressure field for Hurricane Adrian on 06/20/99
at 14 UTC estimated from AMSU observations.
|
|
|
 Hamsu3.gif: A radial-height cross section of azimuthally averaged temperature anomaly for hurricane Adrian on 06/20/99 at 14 UTC estimated from AMSU observations. |
 Hamsu4.gif: A radial-height cross section of azimuthally averaged
tangential wind for hurricane Adrian on 06/20/99 at 14 UTC estimated from
AMSU observations.
|
The height and wind retrieval technique also shows promise for applications
at high latitudes. The retrieval method was applied to an upper level trough,
as shown in Hamsu5.gif. Hamsu6.gif shows the 400 mb geopotential
height field from the AMSU analysis and from the operational NCEP analysis.
The trough in the AMSU analysis was deeper, and more cut off than that
in the NCEP analysis. Work is underway to estimate the accuracy of the
heights and winds estimated by the retrieval technique by comparison with
in situ observations.
 Hamsu5.gif: Water vapor image and location of AMSU data for an upper-level trough at 0400 UTC on 6/24/99. |
 Hamsu6.gif: Geopotential height field at 400 hPa determined from AMSU data and from NCEP operational analysis for an upper-level trough at 0400 UTC on 6/24/99. |
A revised version of an "expert system" to predict the intensity of
tropical storms and hurricanes 24 hours in advance has been readied for
evaluation during this year's hurricane season. The system combines
qualitative input based on animated GOES imagery with quantitative information
from operational models to derive its 24-hour
forecast intensity.
A project is underway to document three to six hour oscillations of deep convection associated with the inner core region of tropical cyclones. This is a new discovery that is in addition to the more commonly known diurnal cycles of deep convection that occur in tropical cyclones and deep oceanic convection. A draft paper has been written and internally reviewed. Work is continuing to improve this documentation with hopes of submitting results for publication next quarter.
Automated collection of several data sets has been begun for the hurricane season. These data include 3-hourly cloud track winds, European Research Satellite 2 Scatterometer winds, and six hourly GOES sounding data over the tropics. Other data sets are being collected on Tropical RAMSDIS including global rawindsonde and surface data, and 4 km Infrared images over tropical cyclones.
An hourly rainfall archive, which covers the continental US from 1947-1998, has been obtained from a commercial source. This CD-ROM-based archive is being used to create special hourly rainfall datasets coincident in time and location with 33 hurricanes and 33 tropical storms known to have made US landfall during its span of data coverage. These special datasets will be analyzed in detail in order to gain insight into whether a pattern exists in the relative amount of rainfall measured, with respect to the track, of land falling tropical cyclones.
The attached figure (camille.gif) shows an example of the data coverage for the landfall of Hurricane Camille (1969).

Camille.gif: The location of rain gage data and the storm track for
the landfall of Hurricane Camille in 1969.
(Click on image to enlarge)
Research continues on a quantitative assessment of the vertical wind shear forcing on Hurricanes Opal, Bertha, and Erika. The final set of computations is nearly complete and an outline of a paper has been completed.
An investigation was completed to evaluate the timing of maximum intensity as revealed by objective IR intensity estimates versus aircraft observations for rapidly intensifying tropical cyclones. Five Atlantic hurricanes and nine western Pacific typhoons were studied. Using several different criteria, the satellite estimates of the time maximum intensity generally precede the aircraft measurements of intensity peak, by up to 23 hours, with an average of about 12 hours. These results illustrate the utility of the satellite estimates for short range predictions of rapidly intensifying tropical cyclones. This validates a finding of a study by Lander (1999) for Northwest Pacific typhoons for which aircraft observations were not available
A dramatic difference in the thermal structure of two similarly looking cyclonic weather systems was documented to show the capabilities of the Advanced Microwave Sounding Unit. One storm system had tropical origins and had a warm core throughout the depth of the troposphere while the other originated in the subtropics and had a very strong warm core in the upper troposphere with a cold core below. The note has been internally reviewed and will be submitted for publication in the next quarter.
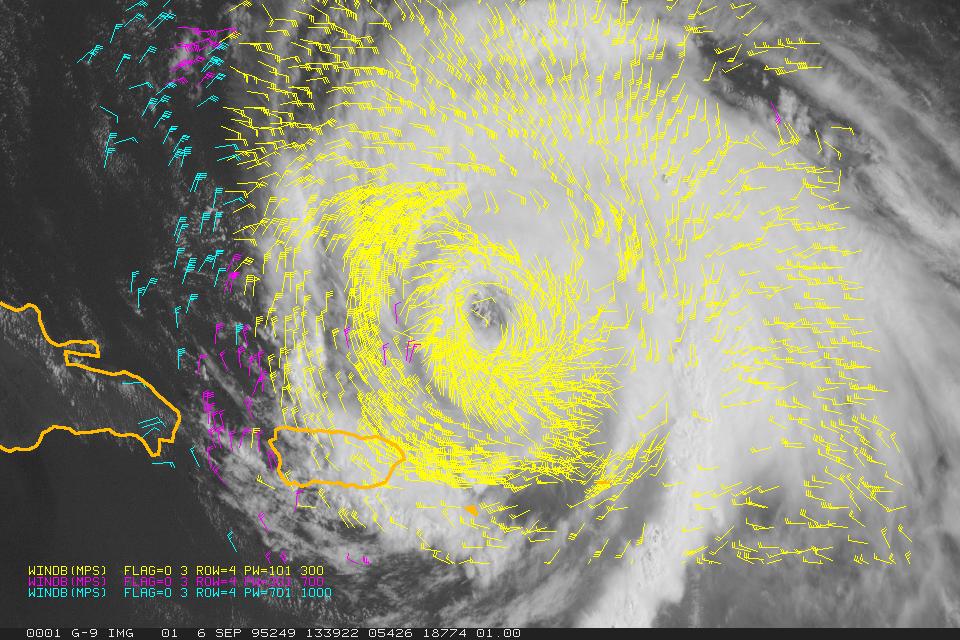
Work continues to create detailed wind analyses near the center of tropical
cyclones using super rapid scan (SRSO) imagery. Collaboration
with Chris Velden at the Cooperative Institute for Meteorological Satellite
Studies has resulted in a method to automate the creation of very high
density winds in the inner most region of the tropical cyclone using existing
cloud tracking wind software. This method will provide winds and
height assignments using existing GOES satellite technology. Below
are two examples of the wind field that results from this technique. Work
will continue to optimize this technique with the hopes that during the
1999 hurricane season a real-time example can be created and disseminated
to the National Hurricane Center.
 |
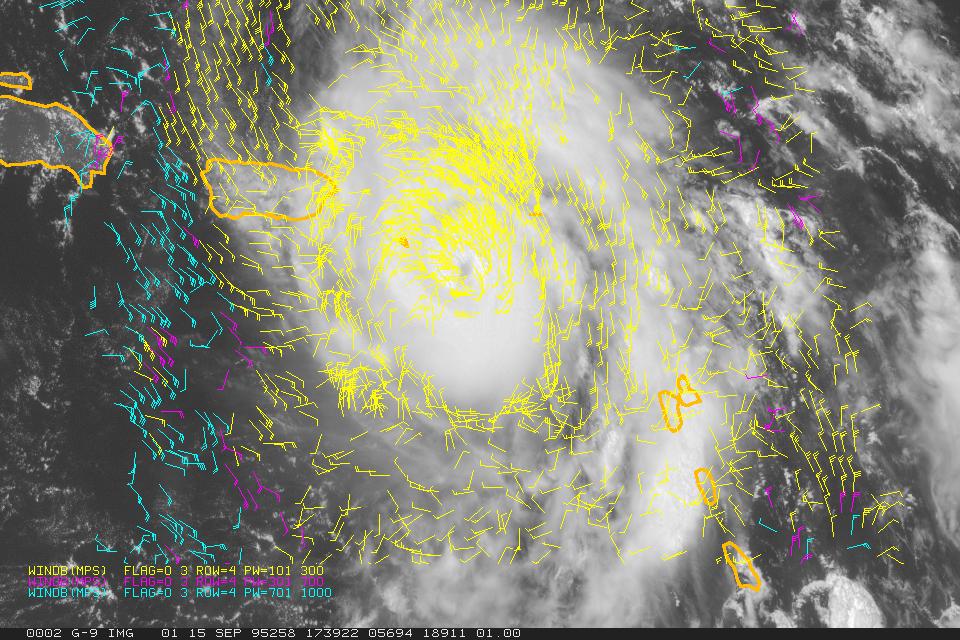 |
Luisqr.jpg, Mariqr.jpg: Examples of winds produced using SRSO imagery collected at CIRA and CIMSS cloud drift wind software. Note that the normal settings, those used for synoptic-scale winds were modified for this application. Images show winds in three layers (100 300, 301-700, and 701-1000 hPa) over Hurricanes Luis (top) and Marilyn (bottom). Both storms occurred in 1995. (Click on images to enlarge)
Final input was provided for a World Meteorological Organization (WMO) Book. R. Zehr is a coauthor with Mohan Karayampudi (NASA) as lead author of Chapter 2 -- Tropical Cyclone Structure and Dynamics. This is a contribution on satellite applications for tropical cyclone analysis, to be used in a Report on WMO Sub-Project No. 19 "Estimating the Amount of Precipitation Associated with Tropical Cyclones Using Satellite Data," Professor Eric Barrett, Chief Editor.