![]()
Development of automated objective eye-detection algorithm: As part of the JPSS-PGRR-TC project, the automated eye detection algorithm was developed in the fall of 2014. Last quarter, it was found that in many cases where a tropical cyclone eye is small, the eye detection algorithm will incorrectly determine that the image does not contain an eye. At that time, the algorithm could only perform classification on low resolution GOES-IR images. Work has been performed to tune the algorithm by allowing high resolution VIIRS IR imagery to be used as input with the goal of reducing the number of incorrect classifications in cases with small eyes. Figure 1 shows an example of raw unprojected VIIRS I5 IR image that was used for testing. In order for a VIIRS image to be compatible with the algorithm's previous training, the data must be regridded to the GOES IR image grid. Work has been completed to perform this transformation using interpolation as well as verification that this data can be used with the previously implemented eye-detection algorithm. (R. DeMaria)

Figure 1. Unprojected raw VIIRS IR I5-band image (375 m resolution) of hurricane Edouard, al062014. This image is a typical example of the image with the small eye, which is incorrectly classified by the current automated eye-detection algorithm.
Bias-correction was developed for ATMS-MIRS soundings based on the comparison with Atlantic dropsondes: As part of the JPSS-PGRR-TC project, the ATMS soundings were adjusted based on the comparison with dropsonde soundings. Figure 1 shows an example of how the warm core sounding changes as result of applying bias-correction to the ATMS-MIRS data for the Atlantic basin. Figure 1 (Left) is produced from the original ATMS data, and Figure 1 (Right) is produced from bias-corrected ATMS data. The warm core signal becomes stronger at the upper levels in the bias-corrected version, which is more consistent with the warm core structure described in the literature (e.g. Hawkins and Rubsam 1968). In addition, the air temperature at the lower levels looks more realistic in the bias-corrected plot at a distance of 200-300 km from the storm center. Also, the cold anomaly in the center of the storm at the lower levels, when present, is removed by the bias corrections. (G. Chirokova)
Figure 1. Warm core structure as depicted by ATMS-MIRS temperature retrievals. The left panel shows uncorrected plot. The right panel shows ATMS-MIRS temperature profile corrected by the bias relative to dropsondes. The corrected version provides more pronounced (larger amplitude) warm core at the upper levels, and removes some cool anomalies at the lower levels. The image is shown for the Hurricane Edouard, al062014.
Testing of MPI and RII algorithms using preliminary pre-operation 2012-2013 dataset and 2014 season AL data: As part of the JPSS-PGRR-TC project, the SHIPS, LGEM and RII were tested using corrected ATMS soundings. The 2014 version of the SHIPS/LGEM model was used for testing. The SHIPS/LGEM model was run with the operational settings, where MPI is calculated from empirical formula (runs LG61 and DS61); with GFS MPI (runs LG62 and DS62); and with ATMS MPI (bias-corrected run LG63 and DS63, and without bias correction LG65 and DS65). The best results were obtained by using bias corrected ATMS data for the AL (Atlantic), and ATMS data without bias correction for EP (E. Pacific) and (W. Pacific). Table 1 summarizes setting used for different runs. (G. Chirokova, R. DeMaria)
Run ID |
Model |
MPI Calculation Method |
LG61/DS61 |
LGEM/SHIPS |
Statistical MPI |
LG62/DS62 |
LGEM/SHIPS |
GFS MPI |
LG63/DS63 |
LGEM/SHIPS |
ATMS MPI, bias-corrected, averaged 300-600 km from the storm center |
LG65/DS65 |
LGEM/SHIPS |
ATMS MPI, averaged 200‑800 km from the storm center |
Table 1. Settings for different SHIPS and LGEM runs.
Figure 1 shows forecast intensity errors for the test runs. For the Atlantic basin the best results were obtained with LGEM. LG62 and LG63 produce very similar results, and in some cases (e.g. 12 h forecast) the ATMS run LG63 shows smaller errors compared to LG62, as could be seen on Figure 2, upper left. In addition, at 96 hours forecast time all 3 runs show the same error. These results are a considerable improvement from last year's preliminary testing where the ATMS based forecast for Atlantic basin was noticeably worse than the operational version. The SHIPS forecast with ATMS input is also improved; however, most of the time, the operational and GFS versions of SHIPS produce smaller errors. The obtained results confirm that correcting ATMS based on comparisons with dropsondes improves SHIPS and LGEM forecasts. (G. Chirokova, R. DeMaria)
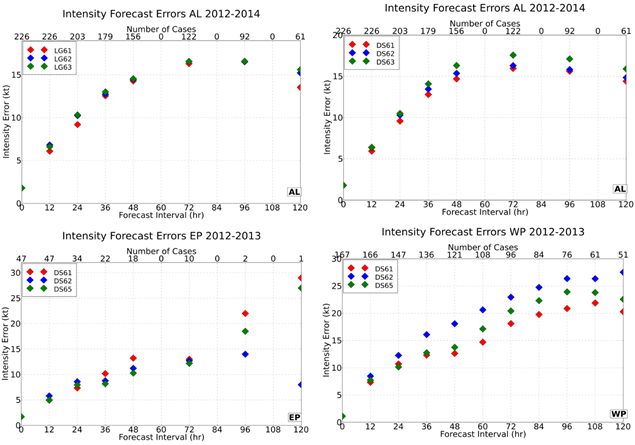
Figure 1. Forecast intensity errors for SHIPS/LGEM with ATMS input. Upper right: LGEM for AL (Atlantic), upper left: SHIPS for AL, lower right SHIPS for EP (E. Pacific), lower left SHIPS for WP (W. Pacific). On all plots red diamonds show runs with the same settings as used operationally, which is LG61 for LGEM and DS61 for SHIPS. Blue diamonds show runs LG62/DS62 which use the GFS MPI. Green diamonds show runs LG63/DS63/DS65 which use the ATMS MPI. Runs LG63 and DS63 for AL use bias-adjusted ATMS profiles averaged between 300 -600 km from the storm center, and run DS65 uses original ATMS profiles averaged in radii between 200-800 km from the storm center.
For the EP (E. Pacific)and WP (W. Pacific) basins the best results were obtained with the SHIPS model. For the EP basin, the ATMS run DS65 outperfoms both operational (DS61) and GFS (DS62) versions for most forecast times as can be seen on Figure 1, lower left. For the WP basin, DS65 has larger errors compared to the operational version; however, it outperforms GFS version (DS62) for all forecast times (Figure 1, lower right). Further forecast improvement could possibly be achived when more data become available.
The bias-corrected ATMS profiles were also used to rerun RII for the years 2012-2014 for the AL. Table 2 shows updated statistics for these runs, as well as the rerun for WP using original ATMS-based MPI estimate. As shown in Table 2, Brier Score (BS) in all cases is slightly smaller when using ATMS profiles to calculate MPI. This indicates a slight improvement. The Brier Skill Score (BSS) and bias, however, show that GFS runs produce slightly better results for the AL basin. The Brier Score for both GFS and ATMS is significantly smaller compared to last year's estimates. The GFS model was updated in 2014, therefore, even though the ATMS estimates are improved, the GFS estimates are improved as well, and, as result, GFS-based MPI produces slightly better estimates. The bias of the RII estimate increased for both GFS and ATMS relative to last year's estimates. That could be due to the increased sample size for the AL. The plots of the RII for individual storms (see Figure 2) show that GFS and ATMS-based RII estimates for the AL are very close to each other. The statistics are based on a very small number of RI cases and should be considered preliminary. (G. Chirokova, R. DeMaria)
Basin |
RI |
BS |
BS |
BS |
BSS |
BSS |
BSS |
Bias |
Bias |
#Cases |
|
|
|
GFS(G) |
ATMS |
Mean(M) |
A/G |
G/M |
A/M |
GFS |
ATMS |
ALL |
RII |
AL |
25 kt |
845.31 |
879.54 |
788.87 |
-2.98 |
-7.16 |
-10.35 |
1.79 |
1.92 |
248 |
22 |
AL |
30 kt |
493.73 |
499.92 |
483.40 |
-1.66 |
-2.14 |
-3.83 |
1.84 |
1.94 |
248 |
13 |
AL |
35 kt |
312.07 |
311.08 |
301.62 |
-1.05 |
-3.46 |
-4.55 |
1.68 |
1.76 |
248 |
8 |
AL |
40 kt |
172.52 |
170.87 |
154.17 |
-2.07 |
-11.90 |
-14.21 |
2.21 |
2.37 |
248 |
4 |
WP |
30 kt |
1026.92 |
969.85 |
1560.02 |
5.56 |
34.17 |
37.83 |
0.56 |
0.65 |
179 |
31 |
Table 2. Statistics for RII. Table shows Brier Score (BS), Brier Skill Score (BSS), and Bias for predicted vs observed RI, as estimated by SHIPS model using MPI calculated using GFS (G) and ATMS (A) profiles. A/G is ATMS relative to GFS; G/M is GFS relative to Mean, and A/M is ATMS relative to Mean.
Figure 2. RII for 25 knots for Hurricane Edouard, AL06 2014. Green dots show observed RII index, which is 0 if no RI occurred, and 100% if RI occurred. Red line with stars shows RI forecast based on operational GFS model fields, and blue line with triangles shows RI forecast with MPI calculated from ATMS data.
Tropical Cyclone Algorithms Tuned to MIRS Retrievals: As part of CIRA's Cal/Val efforts, the tropical cyclone intensity and structure algorithm developed at CIRA was tuned to new satellite data sets. The algorithm, which produces maximum wind speed, minimum central pressure, and the radii of the 34-, 50-, and 64-knot winds, was originally developed for temperature profiles retrieved from AMSU measurements using a statistical retrieval algorithm. Recently, more advanced microwave retrieval schemes have been developed such as the MIRS (Microwave Integrated Retrieval System), NESDIS' current operational microwave retrieval algorithm. As the tropical cyclone intensity and structure algorithm was adapted to the new retrievals, it was necessary to recalculate the coefficients used in the calculation of the maximum wind speed, minimum pressure, and wind radii. The new coefficients are now included in a version of the code which processes retrievals from the AMSU instrument aboard NOAA-18, NOAA-19, MetOp-A, and MetOp-B. In addition, the MIRS algorithm is also used to generate retrievals from the ATMS instrument aboard the S-NPP satellite. As this is a separate instrument, an additional set of coefficients valid for the ATMS/MIRS retrievals was also generated and incorporated into that version of the tropical cyclone intensity and structure code. The following mean absolute error (MAE) statistics were presented at the SPSRB review for the transferal of these two versions of the tropical cyclone structure and intensity code to operations. With the exception of R64 from the ATMS version, all fields met the MAE requirement. (J. Dostalek, G. Chirokova, A. Schumacher, J. Knaff, S. Longmore)
|
Max. Wind (kt) |
Min. Pressure (hPa |
R34 (nmi) |
R50 (nmi) |
R64 (nmi) |
AMSU MAE |
13.2 |
8.4 |
24.9 |
10.6 |
8.9 |
Required MAE |
13.5 |
10.0 |
32 |
18 |
10 |
Sample Size |
4346 |
4347 |
1044 |
601 |
336 |
|
Vmax (kt) |
Pmin (hPa) |
R34 (nmi) |
R50 (nmi) |
R64 (nmi) |
ATMS MAE |
11.4 |
7.4 |
23 |
13 |
14 |
Required MAE |
13.5 |
10.0 |
32 |
18 |
10 |
Sample Size |
783 |
783 |
171 |
110 |
65 |
Dropsonde and MIRS Collocation Database: A database of collocations between dropsondes and MIRS retrievals from both the AMSU (NOAA-18, NOAA-19, MetOp-A, and MetOp-B satellites) and ATMS (S-NPP satellite) was created for Atlantic tropical cyclones for the years 2012-2014. These collocations are a valuable dataset in that the MIRS retrievals can be compared to the "ground truth" of the dropsondes. This information will used in CIRA's Cal/Val effort, which has a particular focus on the performance of microwave retrievals in the vicinity of tropical cyclones. (G. Chirokova, J. Dostalek)
Tropical Cyclone Model Diagnostics Released: Version 3.0 of the code to calculate tropical cyclone (TC) large-scale model diagnostic files (based off the environmental diagnostics used in the statistical-dynamical TC intensity models SHIPS and LGEM) has been released to the Hurricane Forecast Improvement Project (HFIP) community. These diagnostics are used to evaluate model TC environments and generate statistical-dynamical TC intensity guidance. (K. Musgrave)
Tropical Cyclone Model Diagnostics Shared with JMA: K. Musgrave shared a global version of the code to calculate tropical cyclone (TC) large-scale model diagnostic files with the Japan Meteorological Agency (JMA) to run on their dynamical models. These diagnostics are used to evaluate model TC environments and generate statistical-dynamical TC intensity guidance. (J. Knaff, K. Musgrave)
CIRA's tropical cyclone intensity and structure code: CIRA's tropical cyclone intensity and structure code has been running operationally for over a decade at NCEP using statistically-based retrievals from the AMSU instrument. The combination of using statistical retrievals and running on the NCEP supercomputer made this product difficult to maintain and update. To hopefully alleviate those issues, this suite of programs was adapted for use with NESDIS' current operational microwave retrieval algorithm, the Microwave Integrated Retrieval Scheme (MIRS). Two products were created. The first makes use of AMSU-based MIRS retrievals and runs in the Environmental Satellite Processing Center (ESPC) while the second makes use of ATMS-based MIRS retrievals and runs in the NPOESS Data Exploitation Environment (NDE). Using MIRS retrievals, the code produces estimates of intensity (minimum SLP & maximum winds) and structure (in terms of 34-, 50-, and 64-knot wind radii) for tropical cyclones worldwide. The AMSU//MIRS code is now running operationally at OSPO. The ATMS version of the code is undergoing final setup and should be running operationally in NDE shortly. The output of these programs is made available to tropical cyclone forecasters at NHC and JTWC and will be archived on the CLASS website. (J. Dostalek)
Finalizing updates to the Monte Carlo (MC) wind speed probability model: Several updates to the MC model, developed under Joint Hurricane Testbed support, are being tested in real-time during the 2015 Atlantic and N.E. Pacific hurricane seasons. The updates include replacing the linear forecast interpolation scheme with a more precise spline fit scheme, applying a bias correction to the model track error statistics to provide consistency between NHC's uncertainty products, and applying a bias correction to the radii-CLIPER used by the MC model to improve the accuracy of the wind speed probabilities for exceptionally small or large tropical cyclones. After further testing in the last quarter, it has been shown that almost all of these updates improve Brier scores of the MC model over the last 3 years. A website for real-time display of these updates has been created on the RAMMB TC Real-time site at http://rammb.cira.colostate.edu/products/tc_realtime/ (A. Schumacher, K. Micke)
Experimental product providing guidance on tropical cyclone intensity model forecasts running in real-time at CIRA: Final updates have been made to the real-time Predicted Intensity Model Error (PRIME) algorithm. The PRIME algorithm was developed by scientists at the University of Miami under Joint Hurricane Testbed support. This algorithm was developed into a real-time product by scientists at CIRA and is, as of 1 June 2015, running experimentally at CIRA during the 2015 Atlantic hurricane season. A website for real-time display of PRIME has been created on the RAMMB TC Real-time site at http://rammb.cira.colostate.edu/products/tc_realtime/ (A. Schumacher, K. Micke)
Figure. Bias-corrected consensus intensity forecast for Tropical Storm Ana calculated by PRIME, which will be demonstrated on the RAMMB TC Realtime website (http://rammb.cira.colostate.edu/products/tc_realtime/) during the 2015 Atlantic hurricane season.
Tropical Storm (TS) Ana Surface wind analyses: The first automated surface wind analyses that combine the satellite-only multi-satellite platform tropical cyclone wind analyses with information received from reconnaissance aircraft (flight-level winds, SFMR surface wind speeds) were created for Tropical Storm Ana. There have been several improvements from the algorithm run in 2014. It is hoped that after the 2015 season, this JHT project will be recommended for operational transition (it is currently in a deferred decision state). The figure below shows the wind analyses as TC Ana approaches the coast of North Carolina. (J. Knaff)
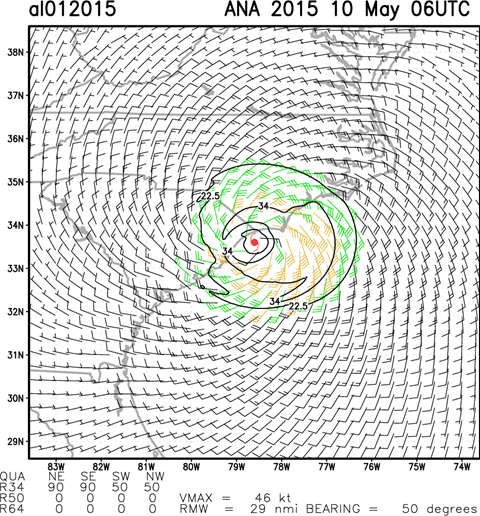
Figure 1: An automated tropical cyclone surface wind analysis that combines the MTCSWA with real-time information from reconnaissance aircraft. At this time the NHC was estimating Tropical Storm Ana's intensity as 40 knots with 34-knot wind radii of 70, 110, 60, and 40 in the NE, SE, SW, and NW quadrants. Maximum flight-level winds were 33 m/s at 843 hPa.
More progress on TC structure estimation: More progress has been made towards the goal of developing a method that could provide quality TC wind radii from routinely available information (storm location, storm motion, storm intensity, and patterns in IR imagery). Table 1 shows the statistics associated with these wind radii estimates and Figure 2 show how these errors behave when they are stratified by location, intensity, size and motion information. A manuscript describing this methodology which is based on a combination of IR size estimates (Knaff et al. 2014), the wind radii cliper wind asymmetries (Knaff et al. 2007), and climatological radius of maximum winds (Knaff et al. 2015) is being prepared for submission in the next quarter. (J. Knaff)
Table 1. Gross statistics of an IR-based method to provide tropical cyclone wind radii provided storm location, motion, and intensity and one IR image. These compare well with other objective methods available to forecasters.
IR-derived R5 |
|||||
Dependent Results (2004-2010), N=13066, N=8214, N=5020 |
|||||
|
NE |
SE |
SW |
NW |
ALL |
R34 MAE |
35 |
31 |
31 |
36 |
29 |
R34 Bias |
-4 |
-6 |
7 |
7 |
-5 |
R50 MAE |
20 |
19 |
19 |
20 |
17 |
R50 Bias |
-3 |
-1 |
7 |
3 |
-2 |
R64 MAE |
13 |
12 |
11 |
13 |
11 |
R64 Bias |
-1 |
0 |
1 |
1 |
-1 |
Independent Results (2011-2013), N=6296, N=3500, N=1762 |
|||||
|
NE |
SE |
SW |
NW |
ALL |
R34 MAE |
44 |
37 |
36 |
41 |
37 |
R34 Bias |
-13 |
-7 |
15 |
5 |
-12 |
R50 MAE |
21 |
21 |
23 |
23 |
20 |
R50 Bias |
-1 |
3 |
12 |
7 |
-3 |
R64 MAE |
13 |
13 |
13 |
14 |
12 |
R64 Bias |
3 |
5 |
5 |
4 |
0 |
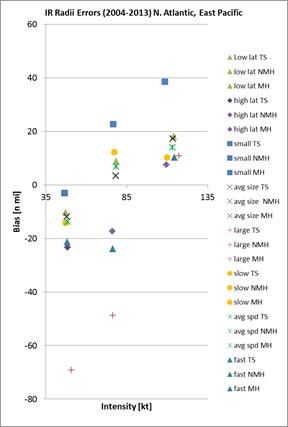
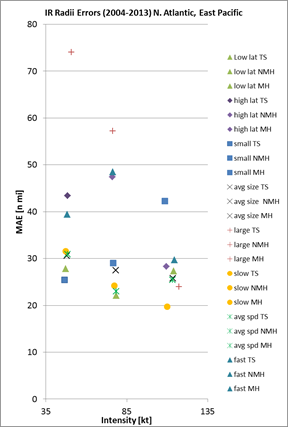
Figure 2. Conditional biases (left) and mean absolute errors (MAE, right) associated with a method to provide tropical cyclone wind radii via routinely available information. Note that errors generally increase with conditions that promote greater asymmetries, but that for all cases errors are lowest for major hurricanes (MH). Performance is reasonable for non-major hurricanes (NMH) and tropical storms (TSs) in most situations.
Presentation at FY16 Annual Review for Satellite Product Development: J. Knaff made a presentation entitled "Upgrade to the multi-platform satellite tropical cyclone surface wind analysis product" that seeks funding (~$187K) to upgrade the MTCSWA product. An example of how the upgrade with affect the product is shown below for Hurricane Blanca. (J. Knaff)
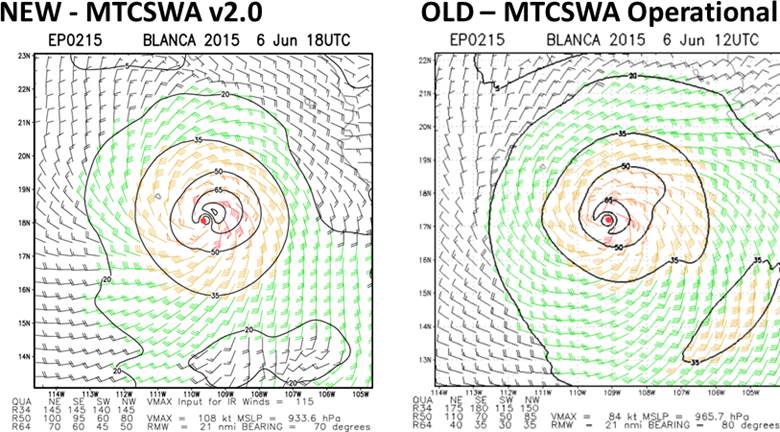
Caption: The panels compare the output from the MTCSWA v2.0 (left) and the operational version of MTCSWA (right) for Hurricane Blanca on 6 June 2015 12 UTC, when the current intensity was estimated at 115 kt.
Near real-time demonstrations begin for two new tropical cyclone (TC) products: Two new TC products, developed with support from the Joint Hurricane Testbed, have been added to the CIRA/RAMMB TC Realtime webpage (http://rammb.cira.colostate.edu/products/tc_realtime/). The first new product is the Predicted Intensity Model Error (PRIME), which estimates bias and mean absolute error for four operational TC intensity models (DSHP, LGEM, HWFI, and GHMI) using storm-based and environmental predictors. The PRIME algorithm was developed by scientists at the University of Miami and the product was developed at CIRA/RAMMB. The second new product is an experimental version of the Monte Carlo wind speed probability algorithm that incorporates several updates and improvements. Both products will be evaluated during the 2015 Atlantic and N. E. Pacific hurricane seasons. (A. Schumacher, K. Micke, J. Knaff)
![]()