![]()
Day-Night-Band (DNB) Technical Interchange Meeting (TIM): The VIIRS EDR Imagery Team participated in the DNB TIM on 9 April 2015. The meeting covered the available options for dealing with the end-of-scan non-linearity issues discovered during thermal testing of the JPSS-1 VIIRS DNB. Two options for changes in pixel aggregation were discussed, with the VIIRS SDR Team preparing for either or both options. Both geo-location and calibration issues related to the DNB changes are being considered. The choice of solutions is also dependent on the needs of end users, in particular those in Alaska, who are quite the advocates of DNB Imagery. The EDR Team hopes to test the effects on any DNB changes on the NCC product at some point, hopefully before the launch of JPSS-1, as that is one of the un-resolved questions for end users of NCC. (D. Hillger, T. Kopp, S. Miller, C. Seaman)
GOES-14 Imagery with Lightning Data: In collaboration with Prof. Steve Rutledge and his group at CSU's Dept. of Atmospheric Science, a real-time feed of data from the Colorado Lightning Mapping Array has been set up to RAMMB/CIRA. The total lightning point locations are being plotted on top of the GOES-14 visible 1-minute imagery and made available on the web in real time at this link: http://rammb.cira.colostate.edu/templates/loop_directory.asp?data_folder=dev/lindsey/loops/g14_vis_lma&image_width=1020&image_height=720&number_of_images_to_display=50&loop_speed_ms=80 Note that this loop is only available on days in which the GOES-14 1-min sector happens to include eastern Colorado. Total lightning provides a nice proxy for the Geostationary Lightning Mapper, an instrument that will be aboard GOES-R next year. This data and imagery are being archived for future research purposes. An example image is below. (D. Lindsey, D. Molenar, S. Miller)
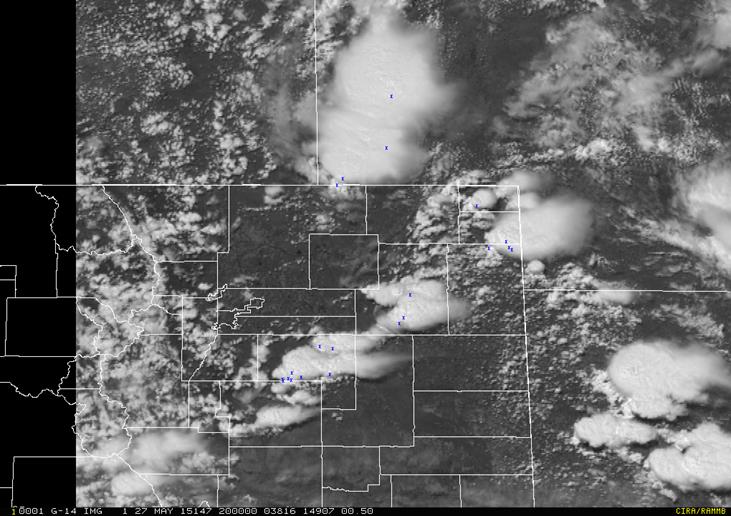
Figure. Example GOES-14 Visible imagery with flashes from the Colorado Lightning Mapping Array overlaid in blue.
Himawari Imagery: Work continues on developing a local webpage to provide an easy method for researchers to begin looking at imagery from the newly-launched Himawari-8 satellite. D. Molenar built a dedicated machine to ingest and process the raw data, and D. Lindsey has been working on scripts to display various bands over several different sectors. The 3.9 μm band has shown a drastic improvement over its counterpart on GOES due primarily to its improved resolution (2 km v/s 4 km) - hotspots associated with fires in southeastern Russia are so well-resolved that one can track the linear fire-line as it races horizontally in strong winds. Some band difference images are also in the process of being added to the webpage. (D. Lindsey, D. Molenar)
Himawari Data: Data from Himawari-8's Advanced Himawari Imager (AHI) began flowing from STAR to RAMMB/CIRA, and D. Lindsey wrote a fortran reader so that the data can be made into imagery and used by researchers in preparation for GOES-R. The AHI is very similar to GOES-R's ABI, and therefore serves as the single best ABI proxy dataset. Below is an example IR band 13 (10.4 μm) image of Super Typhoon Maysag, and a 0.5 km band 3 visible loop is here: http://rammb.cira.colostate.edu/templates/loop_directory.asp?data_folder=dev/lindsey/loops/31mar15_ahi_band3&image_width=1020&image_height=720 . Himawari-8 imagery is also now being provided in real-time here: http://rammb.cira.colostate.edu/ramsdis/online/himawari-8.asp The software to read the raw AHI format has been shared with both the Naval Research Lab and SPoRT. (D. Lindsey, D. Molenar, K. Micke)

Figure. Himawari-8 10.4 μm image of Super Typhoon Maysak from 31 March at 0200 UTC.
Total Lightning Data: D. Lindsey and S. Miller met with CSU Atmospheric Science Professor Steve Rutledge and his student Brody Fuchs to discuss collaboration on a project involving geostationary satellite data and total lightning data from the Colorado Total Lightning Mapping Array. GOES-R will carry the Geostationary Lightning Mapper, so there is great interest in understanding what information colocations of lightning information with satellite data might provide. A web page has been set up to display real-time total lightning flashes overlaid on GOES-13 Visible imagery here: http://rammb.cira.colostate.edu/templates/loop_directory.asp?data_folder=dev/lindsey/loops/g13_vis_lma&image_width=900&image_height=520&number_of_images_to_display=45. A new graduate student of Prof. Rutledge's will arrive this Fall, and D. Lindsey and S. Miller plan to work with her on a GLM-related research project. (D. Lindsey and S. Miller)
CIRA GOES-R Groundsystem Status: Progress on the implementation of the CIRA GOES-R groundsystem is on target. Receiver hardware is due to arrive in May. The necessary Colorado State University Facilities paperwork needed to pour the pad is complete. Data from the GOES-R Simulator and STAR Himawari service is being used to evaluate high speed data storage requirements. Storage platforms from several vendors are under review. Design of a web based platform to serve GOES-R data is underway. (D. Molenar, D. Lindsey, D. Hillger, J. Knaff, M. Hiatt, N. Tourville, S. Finley, K. Micke, S. Miller, R. Brummer)
WRF-ARW P3-MICROPHYSICS: In the past, microphysical routines have partitioned microphysical habit types into distinct categories. For example, ice-water was portioned into three habit types: ice, snow, and graupel. Mass and number are then two prognostic quantities for each of the three ice-water habit types; thus, six predictive equations. A new microphysics in WRF-ARW, P3, treats ice-water as one category and thus predicts only two quantities: mass and number. Radiative transfer routines, however, require mass and number for ice, snow, and graupel as distinct ice-water habit types. One consequence, therefore, is to develop a procedure to partition the one ice-water habit of P3 into three distinct habits: ice, snow, and graupel. Such a procedure was developed at CIRA and the resulting synthetic GOES-13 image at 10.7 µm is shown along with observations. (L. Grasso)


Figure: Synthetic (left) and observed (right) GOES-13 at 10.7 µm.
HWRF-V3.6 SIMULATION: Hurricane Leslie was simulated using the operational version of HWRF version 3.6. One goal was to assimilate satellite retrieved liquid and ice condensate into HWRF. Synthetic imagery was produced to aid in the comparison of the simulated storm with observations. Remapped synthetic and observed imagery, on the same domain, is displayed for grid1, grid2, and grid3. (L. Grasso)


Figure: Synthetic (left) and observed (right) GOES-13 at 10.7 µm of hurricane Leslie for grid 1.


Figure: Synthetic (left) and observed (right) GOES-13 at 10.7 µm of hurricane Leslie for grid 2.

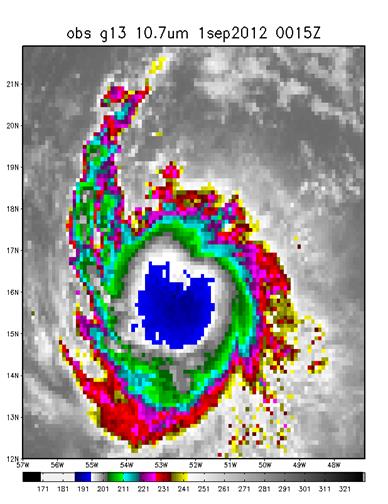
Figure: Synthetic (left) and observed (right) GOES-13 at 10.7 µm of hurricane Leslie for grid 3.
RAMMB/CIRA near real-time Himawari ingest: The RAMMB/CIRA near real-time Himawari ingest from StAR serves a 3-week rotating archive of data to RAMMB/CIRA research staff. To date, 10 cases supporting research on typhoons, blowing dust and severe storms are available from permanent archive. (D. Molenar and D. Lindsey)
New GOES-R 4.5 m antenna installed: Data from the GOES-R Simulator and STAR Himawari service is being used to evaluate high speed data storage requirements. Storage platforms from several vendors are under review. Design of a web-based platform to serve GOES-R data is underway. (D. Lindsey, D. Molenar, M. Hiatt, N. Tourville, S. Finley)
![]()