![]()
NOAA/NESDIS/PSDI/NDE/S-NPP Tropical Cyclone Algorithm: One upgrade and one major release (NPP_TC v1.3.4, 1.4.0) were developed, tested and migrated to the NDE development and test servers including 14 ATMS test cases. Release highlights include a workaround to incorrect MIRS ATMS netCDF scaling values and a migration/calibration from MIRS ATMS cloud liquid water (CLW) to liquid water path (LWP) and improved error code handling. The S-NPP TC products are being tested in real-time and will be briefed to the SPSRB shortly thereafter (est. August 2014). (S. Longmore, A. Schumacher, J. Dostalek)
NOAA/NESDIS/PSDI/AMSU Tropical Cyclone Algorithm: Real-time set-up and testing of AMSU TC version 1.1.1 is currently being performed at CIRA/NESDIS OSPO. (S. Longmore, J. Dostalek)
Atlantic Tropical Cyclone Dropsondes: K. Musgrave organized and performed quality control on dropsondes released over Atlantic tropical cyclones during the 2012 and 2013 hurricane seasons. Although created for the calibration and validation of the tropical cyclone products generated by CIRA, the dataset will likely prove useful for other studies. (K. Musgrave, J. Dostalek, J. Knaff)
HFIP Retrospective Testing Completed: The retrospective testing of SPICE for inclusion in HFIP’s 2014 real-time demonstration was completed and turned in to the Developmental Testbed Center. The testing included the 2011-2013 Atlantic and East Pacific hurricane seasons. (K. Musgrave)
Tropical Cyclone Genesis Index Running in Real-time for 2014 Atlantic Hurricane Season: A Joint Hurricane Testbed project to create a disturbance-following tropical cyclone genesis index (TCGI) was completed this spring and is awaiting final decision on whether or not it will be promoted to operations for the National Hurricane Center (NHC). This project was a collaboration between NOAA/AOML/Hurricane Research Division, Florida State University, CIRA, and NOAA/NESDIS/StAR scientists. The TCGI is running in real-time at CIRA for the 2014 Atlantic hurricane season. Output guidance is available to researchers and NHC forecasters via the RAMMB webpage: http://rammb.cira.colostate.edu/realtime_data/nhc/tcgi/. (A. Schumacher, K. Micke)
NOAA/NESDIS/PSDI/S-NPP Tropical Cyclone Algorithm Preparing for Operational Implementation: The NDE test system (TEST) was reinstated in June 2014 and the NPP TC Products (NTCP) delivered algorithm package (DAP) version 1.3.4 was successfully installed and run in real-time testing. During the time TEST was being rebuilt, CIRA scientists discovered an issue with the algorithm’s use of MiRS ATMS cloud liquid water variable. This issue, in addition to an error logging change requested by NDE technicians and bias correction added to improve algorithm estimates, is addressed in the latest version of the NTCP DAP (v1.4.0) that will delivered by 2 July 2014. The project will have an Operational Readiness Review in July and will be briefed to the SPSRB for operational implementation in August 2014. (A. Schumacher, S. Longmore, J. Knaff, J. Dostalek)
The Advanced Technology Microwave Sounder (ATMS) - based Sounding and MPI: The experimental version of ATMS environmental soundings and MPI estimates is now available on RAMMB/CIRA TC Real-Time web page at http://rammb.cira.colostate.edu/products/tc_realtime/. The new product, the “Advanced Technology Microwave Sounder (ATMS) - based Sounding and MPI” is using ATMS-MIRS data to calculate environmental sounding for each active TC at each synoptic time. The ATMS-MIRS temperatures and moisture profiles are used together with weekly Reynolds SSTs for this product. ATMS Maximum Potential Intensity (AMPI) estimates are obtained using Bister and Emanuel’s (1998) algorithm, using as input the temperature profile, mixing ratio profile, and sea level pressure (SLP) azimuthally averaged between 200 and 800 km from the storm center, and SST at the center of the storm. For comparison we also calculate RMPI, the SST-based MPI (DeMaria and Kaplan, 1994). In addition to the sounding shown at each plot are: SST at the storm center (SST, degC), environmental SLP (SLP, mb), AMPI (kt), RMPI (kt), environmental CAPE (CAPEenv, J/kg), CAPE at the radius of maximum winds (CAPErmw, J/kg), and saturated CAPE at the radius of maximum winds (CAPErmws, J/kg). The DDS ATMS-MIRS data feed is not yet available at CIRA, and currently the product is using developer's data, which are usually delayed by one or 2 days, and are not necessary available every day, as well as some manually downloaded data. For these reasons the product is currently running in demo mode and is updated whenever possible, but not necessary every day. The product will be finalized when the permanent ATMS-MIRS data feed becomes available at CIRA. Currently due to the way we are getting data, the product is expected to be updated with at least a 1 or 2 days delay. Figure 1 shows an example of the new product as seen on the web page. The loop showing sounding and MPI changes during 2014 major hurricane Amanda could be also seen here: http://rammb.cira.colostate.edu/products/tc_realtime/loop.asp?product=snppasnd&storm_identifier=EP012014&starting_image=2014EP01_SNPPASND_201405230000.
(G. Chirokova, R. DeMaria, K. Micke)
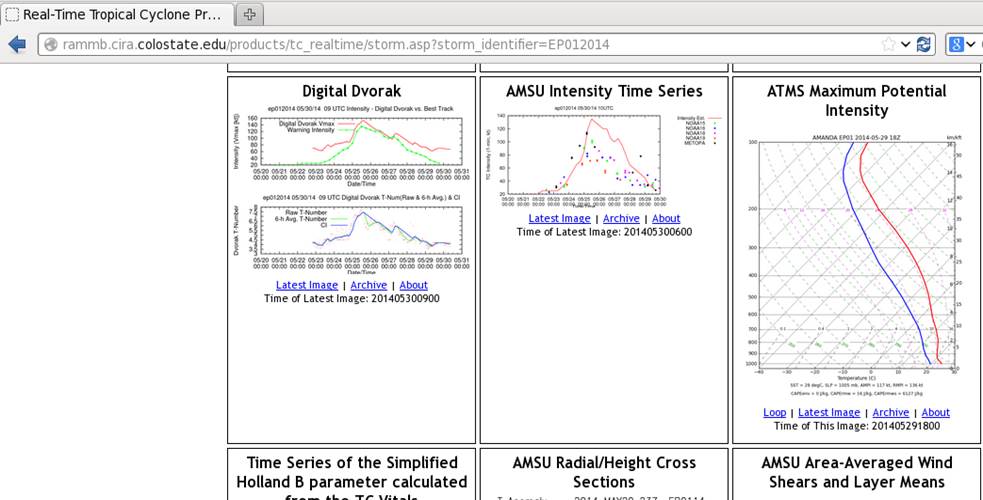
Figure 1. MIRS-ATMS real-time tropical cyclones sounding and MPI product, a snapshot from RAMMB/CIRA TC Real-Time page. The snapshot shows the ATMS MPI product among other similar products available on TC Real-Time page. The ATMS-MPI product image shows the environmental sounding and calculated values of CAPE and MPI for 2014 East Pacific Major Hurricane Amanda for 29May 2014.
VIIRS Tropical Cyclones Storm-Relative Real-Time Imagery:
The storm-relative Visible Infrared Imaging Radiometer Suite (VIIRS) tropical cyclones products, developed last quarter, have been successfully running and capturing in a fully-automated procedure and displaying on the web interesting examples of DNB imagery. For example, a very nice night-time image (12:40 AM Local Solar Time) of Tropical Cyclone Ita from VIIRS DNB (and matching IR) was captured on 10 April 2014 at 15Z. At the time the images were created, Ita was a strong category 4 storm (135 knots according to JTWC) and was approaching Australia. This image is available online at http://rammb.cira.colostate.edu/products/tc_realtime/storm.asp?storm_identifier=SH232014.
(G. Chirokova, J. Knaff, K. Micke, S. Finley, R. DeMaria)
Figure 1. VIIRS DNB Image of TC Ita, on 10 April 2014 15Z, 12:40AM Local Solar Time. At the time of Image TC Ita was Cat 4, at 135 kt (according to JTWC).
Figure 2. VIIRS IR M15Image corresponding to DNB Image at Figure 1.
Cal/Val and JPSS-TC Work: Part of CIRA’s contribution to NESDIS’ Cal/Val efforts is the comparison of MIRS/AMSU profiles to collocated dropsondes in the vicinity of tropical cyclones. Using collocations from 3 hurricanes from 2012 (Ernesto, Isaac, and Sandy) and one tropical storm from 2013 (Karen), a low-level (below 850 hPa) dry bias and a mid-level (700-600 hPa) moist bias of the MIRS/AMSU soundings with respect to the dropsondes was found (Figure 1). As part of CIRA’s JPSS-TC work, Convective Available Potential Energy (CAPE) was calculated using azimuthally-averaged ATMS profiles in the vicinity of tropical storms. The obtained CAPE values are suspiciously low. We are investigating the possibility that the low CAPE values are due to similar biases in the MIRS/ATMS retrievals. (J. Dostalek)
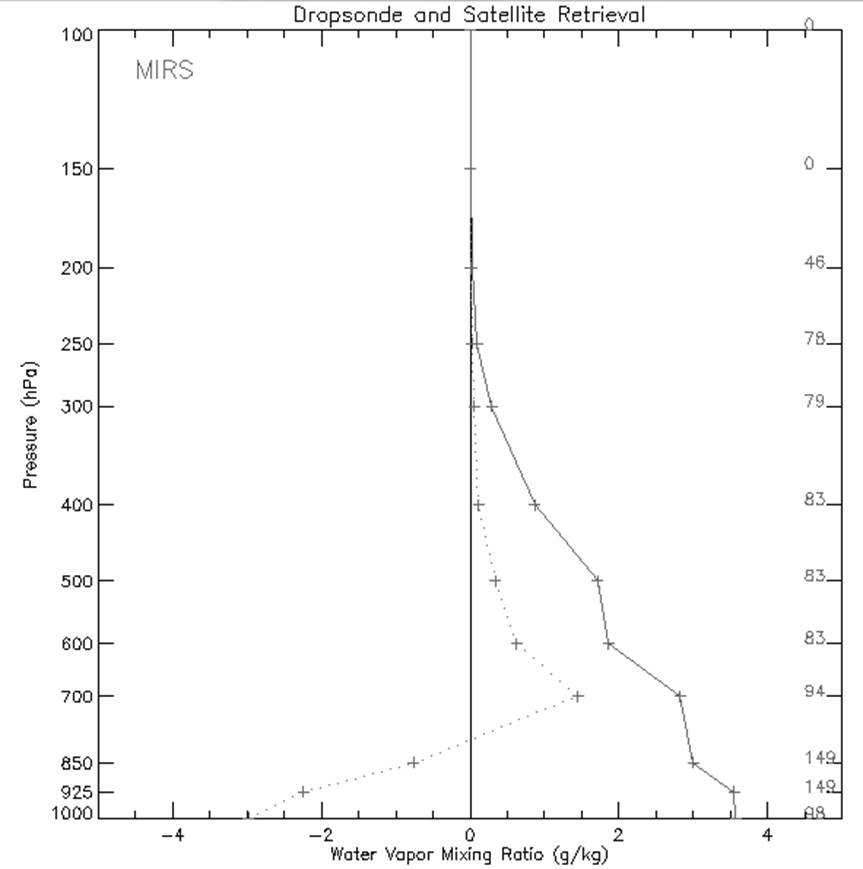
Figure 1. Statistics of AMSU/MIRS profiles collocated with dropsondes, where a collocation is determined if the satellite retrieval is within 1 hour and 50 km of the dropsonde. The number of collocations for each pressure level is given by the numbers on the right-hand side. The bias is dashed and the root mean square error is solid. The collocations occurred for hurricanes Ernesto, Isaac, and Sandy of the 2012 Atlantic season, and Tropical Storm Karen of the 2013 Atlantic season.
Plotting POES Data on Geostationary Images: Programs written at CIRA, in conjunction with intrinsic McIDAS routines, allow for the plotting of polar-orbiting data directly onto geostationary images. The figure below shows NOAA-18 MIRS total precipitable water associated with Typhoon Tapah at 0630 UTC 29 April 2014 plotted over an MTSAT infrared image. Such plots will be used in RAMMB’s Cal/Val and PSDI activities. (J. Dostalek)
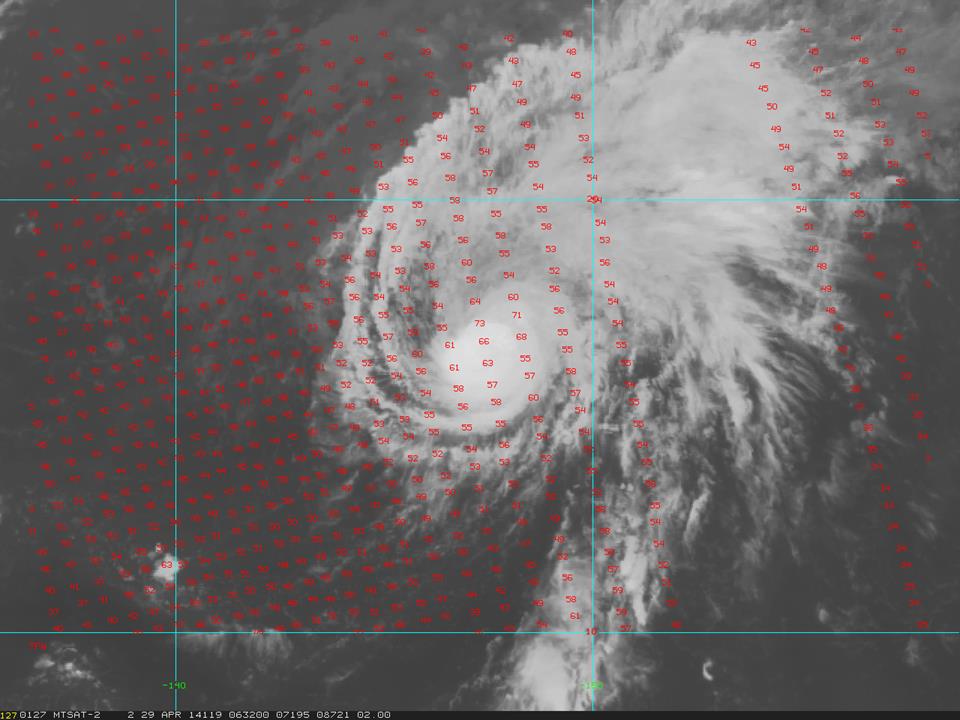
Figure: Total precipitable water (mm) as measured by MIRS retrievals from NOAA-18 over Typhoon Tapah at 0630 UTC 29 April 2014. The background is a longwave infrared image from MTSAT. At this time Tapah’s intensity was 65 kt.
Tropical Cyclone Size Estimation: Using the blended total precipitable water product developed at CIRA, a new method of measuring tropical cyclone size is being investigated. This method uses the radius of the outermost closed contour of total precipitable water to assign a size to tropical cyclones. Figure 1 shows the probability distribution function of tropical cyclone size for the Atlantic and East Pacific basins for the years 1995 to 2011. The mean radius of the Atlantic systems is 356 km. For East Pacific systems the mean radius is 330 km. A Student’s t-test shows that the difference in the mean radius is significant at the 99% level, a result which is consistent with observations that tropical cyclones in the East Pacific tend to be smaller than tropical cyclones in the Atlantic. (J. Dostalek)
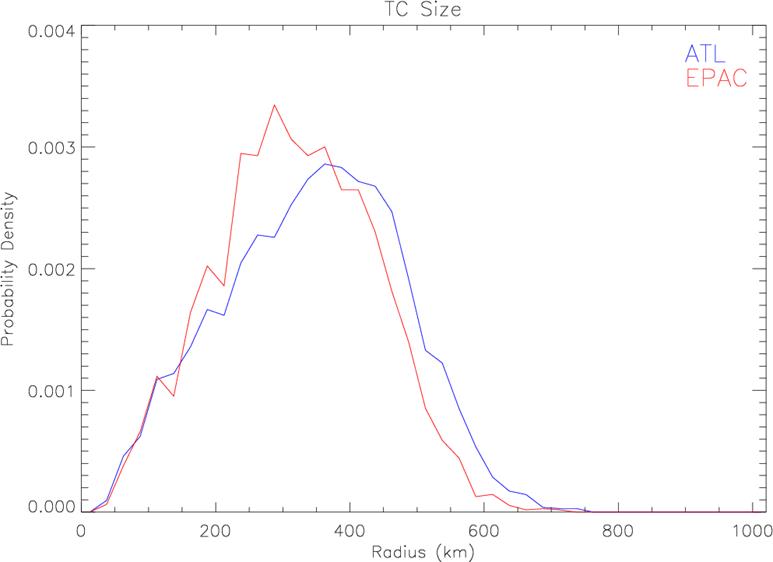
Figure 1: Probability distribution function of radius for tropical cyclones from 1995-2011 in the Atlantic (blue) and in the East Pacific (red) using the outermost closed contour of total precipitable water.
MEANWIND Program created at CIRA: A McIDAS program created at CIRA called MEANWIND, which computes the average vertical wind profile, vertical shear values, and pressure-weighted mean wind using gridded model data, was updated to account for changes in the GFS fields being ingested at CIRA. Although it works at all latitudes, the program was originally designed for use in analyzing the winds in the vicinity of tropical cyclones. (J. Dostalek)
Improving NHC’s operational Rapid Intensity Index (RII): In 2012 an improved method for estimating the probability of rapid intensification of tropical cyclones (RII) that resulted from a JHT funded project was accepted for operational implementation. Improvements are shown in the figure below. However, various changes in computing infrastructure, NHC staff, and data availability have continued to delay its operational implementation. In 2013 the method was run in real-time at CIRA and the output was provided to NHC via web pages – a less than optimal product delivery. In 2014, CIRA has provided the data (NESDIS TPW fields, and storm-direction relative infrared principle components) necessary to run the improved RII algorithm within the NCEP/NHC computing environment. Data delivery is accomplished via the Local Data Manager (LDM). This capability will allow NHC forecasters to access the improved forecast in the intended operational manner. This stop-gap procedure will continue throughout 2014, but it is expected that NHC will begin producing the data supplied from CIRA by the 2015 Hurricane season. (J. Knaff, D. Molenar, N. Tourville)
Figure: Cross-validated skills associated with the RII and the new experimental version of the RI (left) and skill improvements gained by the new experimental version (right). Results are shown for the Atlantic (blue) and East Pacific (red). The new experimental version will be available to NHC forecasters in 2014 as part of the SHIPS forecast that are produced at NCEP using data sent from CIRA to NHC.
IR tropical cyclone image archive updated: Images from 2013 and 1993 in the East Pacific and North Atlantic were added to the CIRA/RAMMB IR tropical cyclone image archive, 16162 and 7172 images respectively. An image showing the eight major hurricanes that occurred in the East Pacific in 1993 is shown below. The rest of the global basin’s images for 2013 are awaiting finalized best tracks from JTWC and CPHC. Once we have this information we will update the archive base. (J. Knaff, M. Troutman)
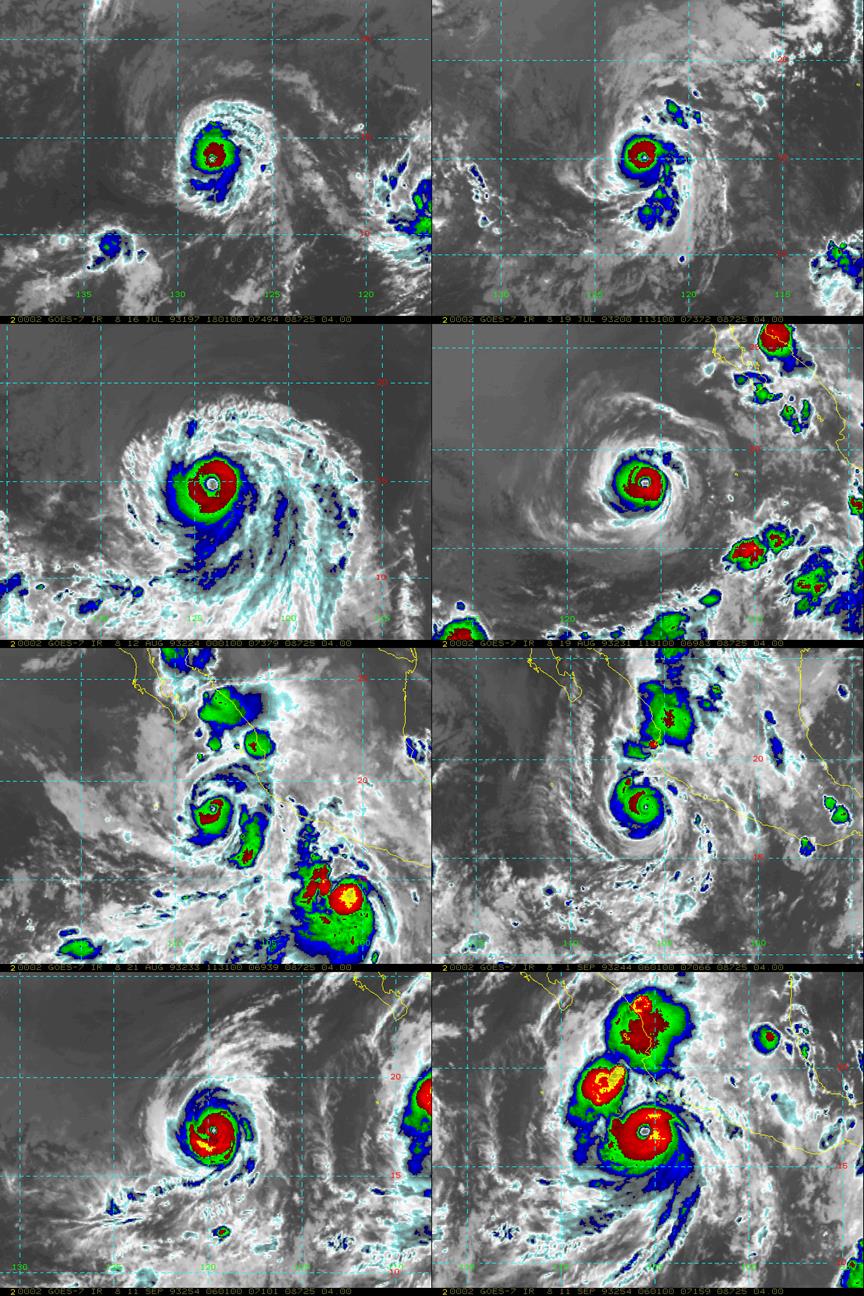
Figure: Eight major hurricanes occurred in the eastern North Pacific during 1993. The panels (top, left-to-right, to bottom) show Hurricanes Dora, Eugene, Fernanda, Greg, Hilary, Jova, Kenneth and Lidia near their times of maximum intensity. Each case is now included in the CIRA/RAMMB Tropical Cyclone IR image archive.
![]()