![]()
Updates to the Monte Carlo wind speed probability product (MC model): Several updates have been made the MC model. The updates include replacing the linear forecast interpolation scheme with a more precise spline fit scheme, applying a bias correction to the model track error statistics to provide consistency between NHC's uncertainty products, and applying a bias correction to the radii-CLIPER used by the MC model to improve the accuracy of the wind speed probabilities for exceptionally small or large (e.g. 2012's Hurricane Sandy) tropical cyclones (Figure 1). Verification over a 3-year sample suggests that the first 2 updates generally improve the MC model at all forecast times while the radii bias correction, in its current form, is degrading the wind speed probability Brier scores. (A. Schumacher)
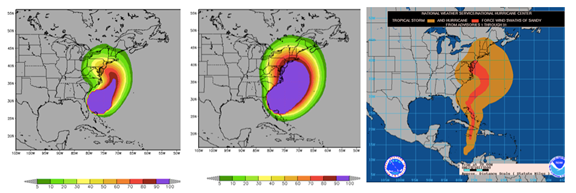
Figure 1. 34-kt wind speed probabilities for Hurricane Sandy before (left) and after (center) radii bias correction.
Observed 34-kt winds are shown for comparison (right, in orange).
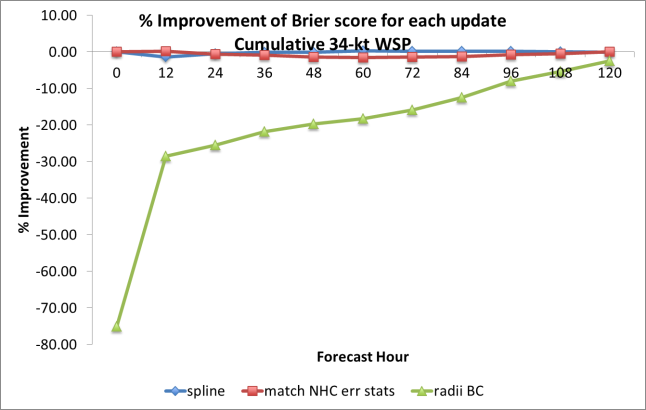

Figure 2. Improvement in Brier score for 34-kt (left) and 64-kt (right) wind speed probabilities for a sample of 2011-2013 Atlantic tropical cyclones.
S-NPP TC Intensity and Structure estimates proceeding towards operational implementation: The S-NPP TC Products (NTCP) algorithm, supported under the NESDIS PSDI program, successfully completed its Operational Readiness Review (ORR) on 11 March 2014. The NTCP will be briefed at the SPSRB meeting on 15 April 2015 where a decision will be made regarding its final transition to operations. (A. Schumacher, J. Knaff, S. Longmore, J. Dostalek)
Progress on TC Wind Radii Tool: In partial response to the WMO's recommendation for the research community to develop tools that represent the TC surface wind field, a new tool that requires just four routine pieces of information: 1) storm motion, 2) storm intensity, 3) storm location, and 4) an estimate of the 500 km tangential winds to produce estimates of 34-, 50-, and 64-kt wind radii around a TC has been developed. Item 4 can be estimated from a model analysis, historical distributions, or directly from IR satellite imagery. The tool has a couple immediate applications including: 1) providing wind radii for routine Dvorak intensity estimates and HIE intensity estimates, and 2) providing wind radii for stochastically generated TC tracks for climate impact and risk studies. An example of wind radii estimates from the TAFB Dvorak intensity estimates is shown below and compared to the working best track (Fig 1k). A manuscript is being prepared for publication. (J. Knaff)
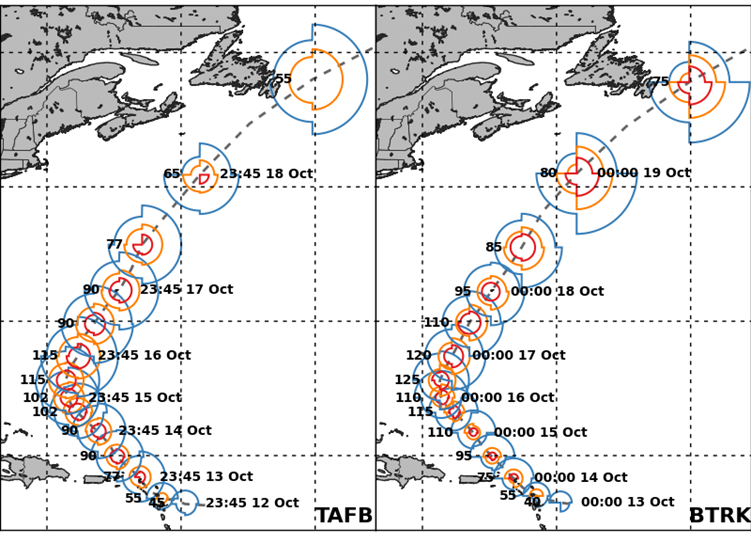
Figure 1k. Twelve-hourly Dvorak intensity and wind radii estimates based on storm location, motion, intensity
and the matching IRimage (left) and working best track wind radii estimates (right).
Consensus wind radii forecasts method was developed: The method makes use of current tropical cyclone tracker output from several numerical weather prediction systems and combines them to provide skillful guidance for tropical cyclone forecasters at the National Hurricane Center. A manuscript entitled "A consensus forecast for tropical cyclone gale wind radii" by C. Sampson (NRLMRY) and J. Knaff was submitted to Weather and Forecasting. (J. Knaff)
Advanced Microwave Sounding Unit (AMSU) and Dropsonde Collocation: Real-time dropsonde/AMSU retrieval collocations have been added to the RAMMB-CIRA TC Real-Time Page, http://rammb.cira.colostate.edu/products/tc_realtime/. This display joins the dropsonde/ATMS collocations and the ATMS MPI estimates, which were leveraged from the JPSS-PGRR_TC project. The product displays the vertical temperature and moisture profiles of dropsondes collocated with AMSU retrievals in the vicinity of tropical cyclones. The AMSU retrieval closest to the dropsonde is selected, and must be within one hour and 100 km from the dropsonde release time and location. Additional information included on the collocation includes the ATCF tropical cyclone id, the tropical cyclone heading angle, the distance from the TC center to the dropsonde, and the horizontal distance between the dropsonde release location and the AMSU retrieval. A collocation will be displayed for any tropical cyclone within 2000 km of a dropsonde. Figure 1 is a screen capture of this portion of the TC Real-Time page for Hurricane Edouard (2014). The online availability of collocations between dropsondes and retrievals allows for the monitoring of the performance of satellite retrievals as a tropical cyclone is occurring. (G. Chirokova, J. Dostalek, K. Micke, R. DeMaria)
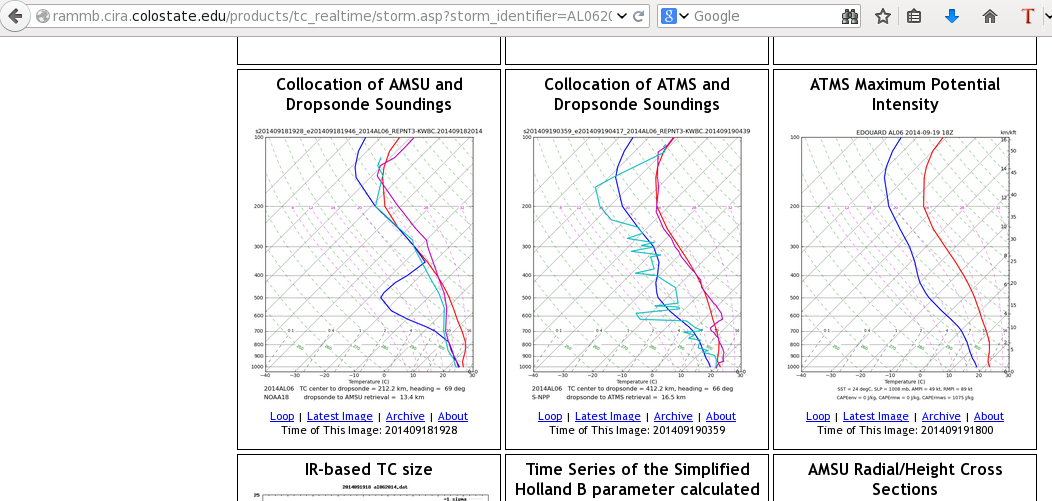
Figure 1. Screen capture from the RAMMB-CIRA TC Real-Time page of Hurricane Edouard,
showing the dropsonde collocations with an AMSU retrieval, an ATMS retrieval, as well as the ATMS MPI estimate.
Development of automated objective eye-detection algorithm: As part of the JPSS-PGRR-TC project, last quarter the automated eye detection algorithm was trained to perform eye/no-eye classification on GOES-IR imagery. A set of cases for which the automated eye-detection algorithm performed poorly on was examined. It was discovered that many cases where a small eye is present were incorrectly classified as having no eye. Currently the algorithm uses GOES-IR data as input and as a result, much of the information around the eye is lost due to the low resolution of the data (Figure 1). Work has been started on testing the automated eye-detection algorithm with high-resolution VIIRS data to overcome this limitation. (R. DeMaria)
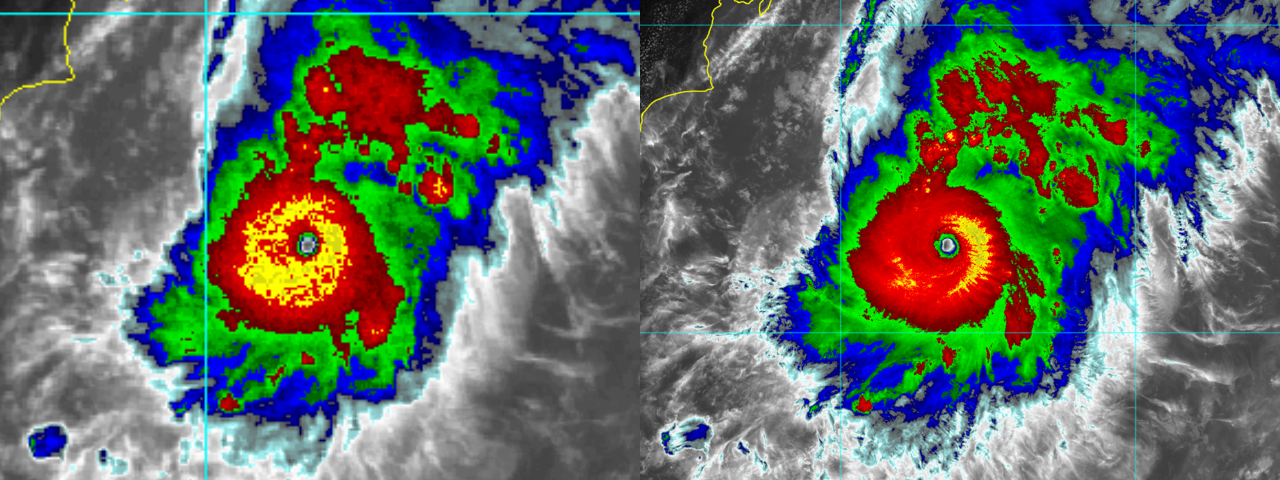
Figure 1. (a) A small eye as depicted by GOES imagery (4 km resolution) and (b) the VIIRS I5-band imagery
(375 m resolution; the image is shown at reduced resolution).
ATMS soundings correction based on comparison to dropsondes: As part of the JPSS-PGRR-TC project, the ATMS soundings were adjusted based on the comparison with dropsonde soundings. A database of approximately 350 Atlantic dropsondes collocated to ATMS and GFS soundings within 100 km was created. ATMS-MIRS, GFS, and dropsonde data for the years 2012-2014 were used to create a database. Figure 1 (Left) shows the number of dropsondes available as a function of distance from the storm center. All collocated dropsondes were split into 100 km bins, at distances from 0 to 1000 km from the storm center, and bias, MAE, and RMSE were calculated as function of pressure and distance to the storm center. It was found that at the center of the storm (0-100 km) ATMS-MIRS soundings are usually better than the GFS. At 300-800 km from the storm center, the ATMS-MIRS soundings usually have a dry and cold bias at the surface, and usually have smaller errors than the GFS soundings. Closer to the surface, approximately below 800 mb, GFS soundings tend to have smaller errors. The MPI estimates were recalculated based on bias corrected ATMS-MIRS soundings, and averaged between 300 – 800 km from the storm center. Figure 2 (Left) shows ATMS-only profiles originally used for MPI estimates, and bias-corrected ATMS profiles (Right). The bias-corrected soundings seem to better represent the boundary layer. In addition, in the corrected soundings the environmental CAPE value is no longer equal to zero. The MPI estimates based on the bias-corrected soundings tend to be smaller than the original MPI estimates. The evaluation of the RII algorithm with the corrected MPI estimates is being conducted. (G. Chirokova)
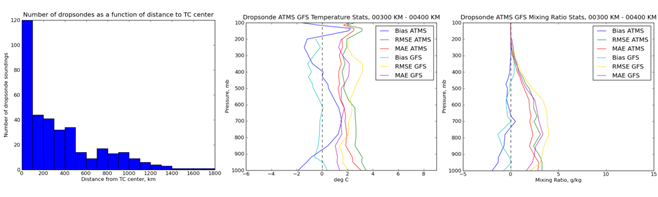
Figure 1.
Left: Number of dropsondes available as a function of distance from the storm center. Center: Temperature bias, MAE, and RMSE for GFS and ATMS-MIRS soundings relative to dropsondes: blue, green, and magenta represent the bias, RMSE, and MAE for ATMS, respectively; cyan, yellow, and magenta represent values for GFS. Right: same as Center, but for mixing ratio.

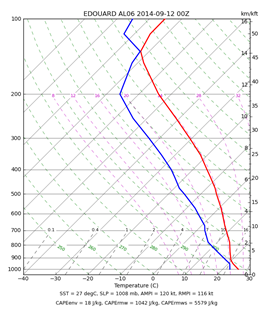
Figure 2. Left: T (red) and Td (blue) as estimated from ATMS-MIRS data. Profiles are averaged between 200 – 800 km.
Right: Same, but estimated from bias-corrected ATMS-MIRS soundings.
![]()