![]()
The Suomi-National Polar-orbiting Partnership (NPP) Tropical Cyclone (TC) production system for the National Data Exploitation (NDE) system first Delivery Algorithm Package v1.2.0 (DAP) was initially tested and delivered on 31 Oct 2013 with follow-up revisions (v1.2.1 – 8 Nov 2013, v1.2.2 – 15 Nov 2013) to the configuration, log and product files. With recommendations from these DAPs, development began on the next versions (v1.2.3 and v1.3.0) during this quarter, which focus interaction with the NDE system and archiving products in the netCDF format. NPP TC v1.2 will begin real-time testing in January 2014. Calibration efforts also began this quarter with newly available MiRS ATMS data. Simulations were initially performed for subsets of data in 2012 and 2013. (S. Longmore)
The parallel Advanced Microwave Sounding Unit (AMSU) Tropical Cyclone (TC) production system (v1.0) that uses AMSU instrument data from NOAA-18, NOAA-19 and METOPA was also delivered on 27 Nov 2013. Recommendations from the initially delivery are now being incorporated into (v1.1). Calibration efforts began this quarter from archived cases and initial simulations have been performed for 2012 and 2013. (S. Longmore)
The Statistical Prediction of Intensity from a Consensus Ensemble (SPICE) forecasts, produced as part of the Hurricane Forecast Improvement Project (HFIP), have been verified for the 2013 season. Results were presented at the 23 October 2013 HFIP teleconference. Figure 1 shows the mean absolute intensity error (in kt) for SPICE in the purple dashed line, compared with Decay-SHIPS and LGEM in blue and red, respectively. SPICE had lower mean intensity errors than both of its parent statistical models at longer lead times, in both the Atlantic (left panel) and East Pacific (right panel) basins. (K. Musgrave)
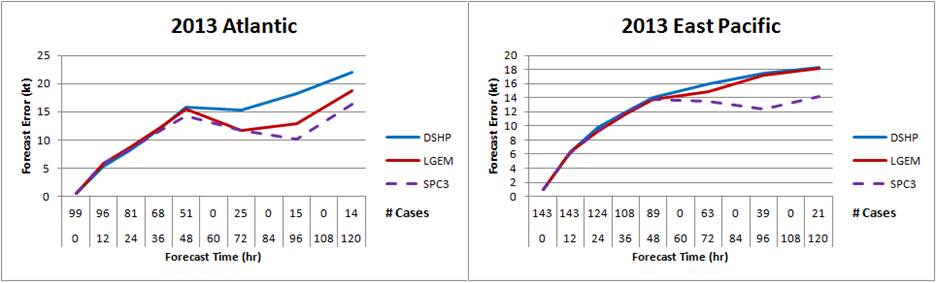
Figure 1: Mean absolute intensity errors (in kt) for the 2013 hurricane season in the Atlantic (left) and East Pacific (right) basins.
Hurricane Forecast Improvement Product (HFIP): L. Grasso and K. Musgrave are developing statistics for the 2013 Atlantic hurricane season. Based on a comparison between synthetic GOES-13 imagery from HWRF and observed GOES-13 imagery, mean absolute errors, biases, and histograms are being produced. (L. Grasso, K. Musgrave)
Super Typhoon Haiyan Media Coverage: Multiple CIRA-generated images and loops of Super Typhoon Haiyan appeared in the media, including in this article by the Capital Weather Gang from the Washington Post: http://www.washingtonpost.com/blogs/capital-weather-gang/wp/2013/11/08/super-typhoon-haiyan-one-of-worlds-most-powerful-storms-in-history-from-space/ (D. Lindsey, J. Knaff)
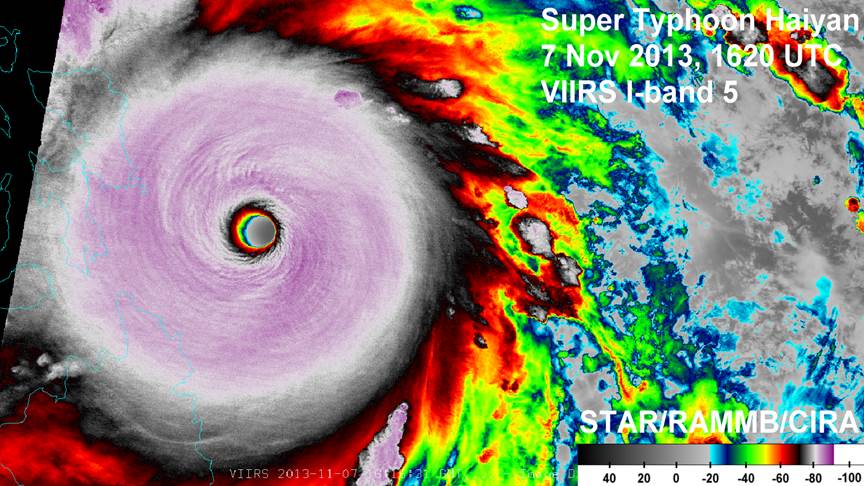
Figure. VIIRS I-band 5 image of Super Tyhpoon Haiyan a few hours before making landfall in the Philippines.
Multi-satellite-platform Tropical Cyclone Surface Wind Analysis (MTCSWA) V2.0: The MTCSWA has been running since 2011 in NESDIS operations. Since that time several aspects of the system have been revisited including how the IR-based flight-level wind proxies are created, how the analysis winds (done at 700 or 850 hPa) is reduced to the surface, and surface inflow angle representation. The IR-based aircraft wind proxy now uses an algorithm that accounts for the 2-dimensional IR image and was developed using a higher-resolution aircraft-based wind analysis. That work is being prepared for publication. The flight-level to surface wind reductions are based on methods developed at NHC and leverage a recently finished Joint Hurricane Testbed project to automate aircraft-based wind analyses in NHC operations (approval pending). The inflow angles are adopted from a parameterization developed at AOML (Zhang and Uhlhorn 2012) which was based on GPS dropsondes. The new V2.0 analyses are being tested in the CIRA environment and being disseminated via the TC-realtime web page. The resulting analyses generally have larger and more physically-based wind asymmetries and provide better estimates of winds at radii beyond 300 km of the TC center. The MTCSWA (V1.0 and V2.0) for Tropical Cyclone Ian are provided below. The top panel shows how the IR and large-scale analyses compare and the bottom panel compares the current MTCSWA with MTCSWA V2.0. We wish to seek funding for operational transition in FY2014 or 2015. (J. Knaff)
Caption: MTCSWAs for Tropical Cyclone Ian (SE Pacific) valid 12 UTC 9 January 2014. Scaled IR image and MTCSWA V2.0 (top panels) and a comparison of MTCSWA V1.0 (bottom left) and MTCSWA V2.0 at smaller scales (bottom right).
Inventory and improvement of CIRA/RAMMB TC Image Archive: RAMMB has been collecting and archiving 4-km, storm-centered, high-temporal resolution, IR images over global tropical cyclones for over a decade. This image archive has been used to improve TC forecasting, diagnostic TC structure and various case studies and is an invaluable resource which we are in the process of improving and expanding. The inventory of images in two of the global basins is complete. The North Atlantic basin contains data for 286 storms and consists of 130,904 images and the eastern North Pacific basin contains 301 storms, and 94,768 images. We will work to fill in the missing data and add storms in the next year using the CLASS and CIRA GOES archives. (J. Knaff)
This quarter, using archived GOES data on CLASS and the CIRA ground station, the CIRA tropical cyclone IR image archive has been expanded to include half-hourly images of east Pacific tropical cyclones for 1997, and 1993 (12336 storm centered images) and historical WV imagery in the Northern Hemisphere now contains data from 1993. The later imagery has been used for development of the operational tropical cyclone formation product and a tropical cyclone recurvature product. We will continue to improve these archives in the next quarter. (J. Knaff)
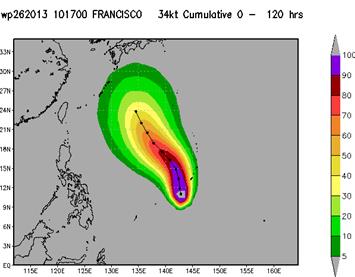
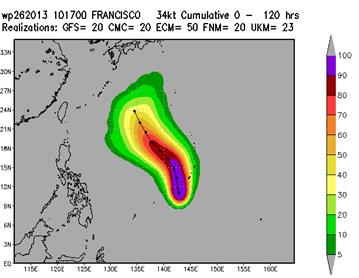
The hybrid wind speed probability (WSP) product developed under the Hurricane Forecast Improvement Project (HFIP) provided experimental guidance for the Atlantic, E. Pacific, and N. W. Pacific basins in 2013. The hybrid WSP differ from the operational WSP in that they use tracks from global model ensembles in lieu of the building track realizations from the official forecast track and climatological forecast errors. The hybrid WSP are expected to have an advantage over the operational WSP in situations where two or more near-equally likely forecast track scenarios exist for a given TC at a given time. For example, N. W. Pacific Typhoon Francisco was expected to take either a westward track or a northeast recurvature track on 17 October 2013. The statistical WSP (Figure, left) were unable to represent both of these track scenarios since it is heavily weighted towards the deterministic official forecast track. However, the hybrid WSP (Figure, right) show local probability maxima consistent with the two main track scenarios. The hybrid WSP were run in real-time at CIRA and displayed at on the HFIP experimental products web site in 2013. Verification of the hybrid vs. statistical WSP is currently underway. Preliminary results show that the hybrid WSP have higher Brier scores, and hence less skill, than the statistical WSP in all three basins. Development of an improved weighting scheme is being proposed that may improve the hybrid’s performance in 2014. (A. Schumacher, M. DeMaria, K. Musgrave)
|
|
Figure. The statistical (left) and hybrid (right) 34-kt wind speed probabilities for Typhoon Francisco on 17 Oct 2013 at 0 UTC.
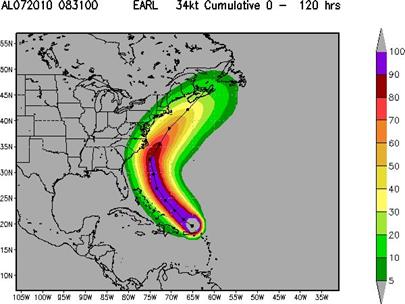
Improvements are being made to the current Monte Carlo (MC) wind speed probability model under the Joint Hurricane Testbed (JHT) program. The starting point for the MC model is the NHC official track and intensity forecasts, which are available at 12 h intervals to 48 h and 24 h intervals from 48 to 120 h. A linear interpolation is used to obtain track and intensity between the forecast times. Verification statistics (DeMaria et al. 2009) show that the errors are larger for the times between the NHC forecast points, and an eastward bias is introduced for re-curving cyclones. This is especially problematic for storms close to the U.S. east coast, but just offshore, because it leads to an underestimate of the probabilities at the coast (e.g., Figure, left). The linear interpolation has been replaced with a spline fit to correct this problem (Figure, right). (A. Schumacher, M. DeMaria, J. Knaff)
|
|
Figure. Monte Carlo wind speed probabilities for Hurricane Earl on 31 August 2010 using a linear interpolation of the official forecast track (left) and a spline fit (right).
CIRA uses temperature profiles retrieved from microwave radiance measurements to compute wind fields in the vicinity of tropical cyclones. A program was written which reformats the wind retrieval data so that it can be read into a McIDAS MD file and subsequently plotted onto a satellite image. Figure 1 shows the 850-hPa winds derived from AMSU data aboard NOAA-15 plotted on top of an infrared image of Typhoon Lekima. The time of the analysis is 1200 UTC on 22 October 2013, and the field of wind barbs has been thinned from the original 0.2° latitude/longitude spacing. (J. Dostalek)
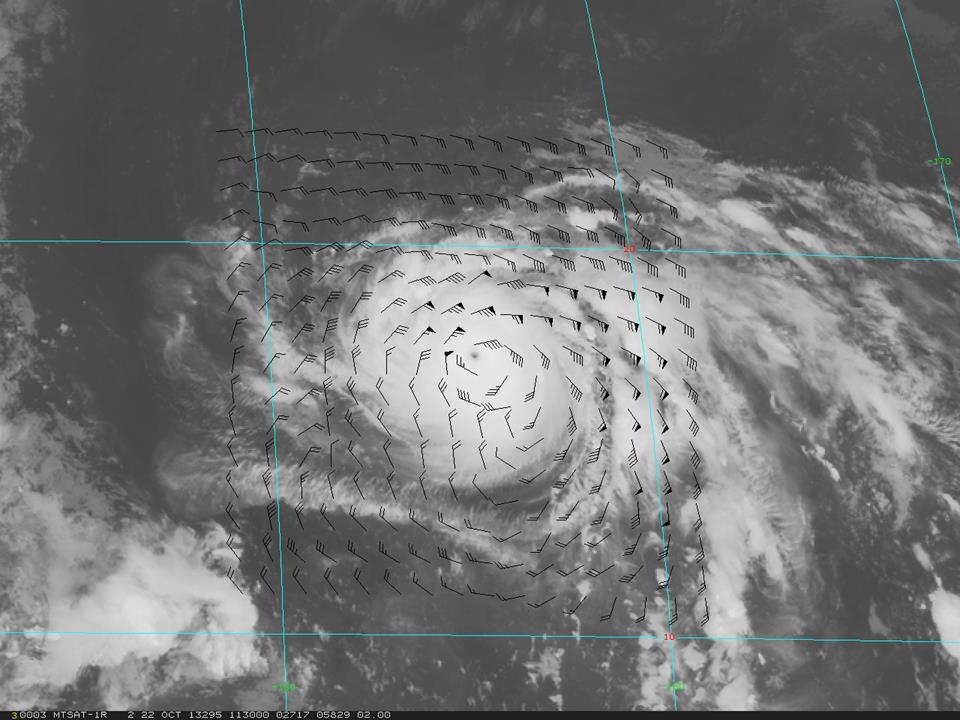
Figure 1. MTSAT-1R infrared image of Typhoon Lekima at 1130 UTC 22 October 2013. Overlaid are the 850-hPa wind barbs from the 1200 UTC wind analysis using AMSU radiances from the NOAA-15 satellite. The intensity of Lekima at this time was 125 kt.
A series of Linux shell scripts, Python scripts, and Fortran programs was developed at CIRA to process in real time Microwave Integrated Retrieval System (MIRS) soundings from polar-orbiting satellites NOAA-18, NOAA-19, and MetOp-A. The soundings are used to create 3-D wind fields in the vicinity of tropical cyclones. The MIRS soundings, based on a 1-D variational approach, are NESDIS’ operational microwave retrievals and are an upgrade to the statistical retrieval technique currently used to generate the wind fields. Version 1.0 of the AMSU TC algorithm, as well as associated documentation, was delivered to NESDIS’ Office of Satellite and Product Operations for initial testing and integration. The product is planned to be operational in June 2014. (J. Dostalek)
The RAMM Branch creates tropical cyclone wind field products which use winds computed from temperature profiles generated from microwave satellite retrievals from the Advanced Microwave Sounding Unit (AMSU). Up to this point a statistical retrieval scheme over 10 years old has been used. In preparation for switching the retrieval scheme to NESDIS’ current operational algorithm, the 1DVAR Microwave Integrated Retrieval System (MIRS), a comparison of the two techniques, is being performed. Data from the 2013 tropical cyclone season are being collected to perform the comparison. The two retrieval algorithms will be compared on the quality of the vertical temperature profiles as well as the quality of the tropical cyclone wind field products generated by the temperature retrievals. This project is part of NESDIS/StAR’s Calibration and Validation Program. (J. Dostalek)
Many tropical cyclone products developed at CIRA and which run operationally at NCEP rely on AMSU brightness temperatures. These brightness temperatures are converted from their original BUFR format to a text format for further processing. It was discovered that occasionally extra data was getting through the BUFR conversion step and into the subsequent processing. Figure 1 presents the problem. The left panel shows the correct input data for the NOAA-18, 12 UTC analysis of 21 November 2013 over Tropical Storm Melissa — two descending passes. The right panel shows the incorrect data — the two NOAA-18 passes seen on the left, with the addition of brightness temperatures from an ascending NOAA-18 pass, and data from MetOp-B. In collaboration with the NOAA staff at the National Hurricane Center and the Office of Science and Technology, the sources of the two problems have been determined and fixes are being developed and implemented. (J. Dostalek)
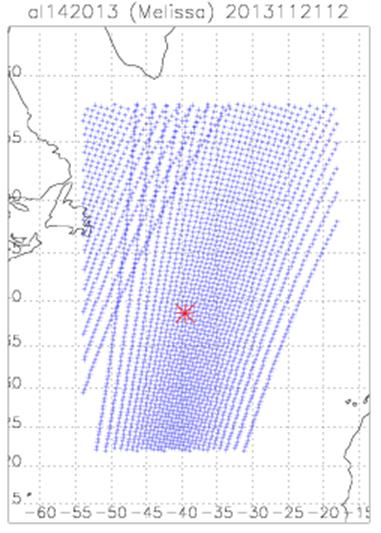

Figure 1. NOAA-18 data locations over Tropical Storm Melissa for 12 UTC 21 November 2013. Left: correct data input consisting of two descending passes. Right: input data with additional, unwanted brightness temperatures from NOAA-18 and MetOp-B. The location of Tropical Storm Melissa is given by the red asterisk.
The McIDAS program meanwind.pgm computes the mean vertical wind profile from model data in the vicinity of tropical cyclones and is frequently used during the tropical weather discussions at CIRA. A problem with processing McIDAS GRID files with duplicate grids was fixed. (J. Dostalek)
![]()