![]()
A standardized hurricane aircraft flight track dataset using the NHC/HRD flight track files for the Atlantic and East Pacific basins from 1995-2004 has been completed. The purpose of this dataset is to supplement current product development and future satellite studies (GOES-R). This dataset was created using a modular text data processing system initially developed by R. DeMaria. This dataset is currently being verified and work continues on 2005-2012. (S. Longmore, J. Knaff)
Work continues on the enhanced windstorm prediction with GOES warning indicators. Currently analyzing 20 wind storm cases in the Wasatch Range in Utah for predictors.
(S. Longmore, D. Lindsey)
Preliminary verification has been completed for the HFIP experimental hybrid statistical-dynamical wind speed probability algorithm. The algorithm began running in real-time at CIRA in Aug 2012 and was displayed on the HFIP experimental product page (http://www.hfip.org/products/). Early verification results suggest that the experimental hybrid product did not perform as well (in terms of Brier score) as the operational wind speed probabilities in the Atlantic during the 2012 hurricane season. More analysis is currently underway to understand why the hybrid algorithm was not as skillful as the operational wind speed probabilities during this Atlantic hurricane season. (A. Schumacher, M. DeMaria)
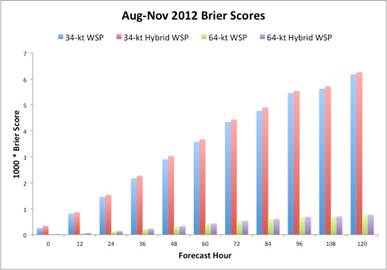
Figure. Brier scores for the operational wind speed probabilities (WSP) and hybrid WSP for Atlantic tropical cyclones from Aug-Nov 2012. Brier scores for both 34-kt and 64-kt WSP are shown.
The experimental 48-hr Tropical Cyclone Formation Probability (TCFP) product is running in real-time at CIRA. The 48-hr TCFP has been implemented on development systems at OSPO and is currently in its pre-operational testing phase. This product is expected to be promoted to operations in late spring 2013 and will replace the NESDIS 24-hr TCFP. The 48-hr forecast period of this new product will better fulfill the needs of the National Hurricane Center and Joint Typhoon Warning Center. (A. Schumacher, M. DeMaria).
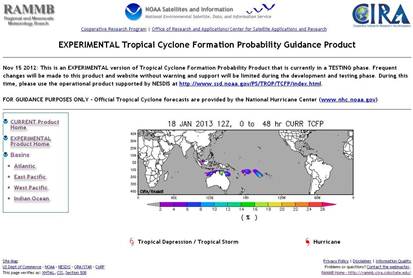
Figure. The experimental 48-hr TCFP, running in real-time at CIRA/RAMMB.
D. Bikos is developing a product that incorporates satellite data and model wind information to forecast tropical cyclone recurvature. The satellite data method is based on a technique by Dvorak (1995) which identifies the distance between the tropical cyclone center and a curved moisture boundary as seen in the GOES water vapor imagery. An example illustrating this technique is depicted in Figure 1. The contours are the gradient of brightness temperatures within a specified range from the water vapor imagery, while the yellow line illustrates the distance between the gradient associated with the curved moisture boundary and the storm center just before recurvature took place. The model wind information is based on a technique by Hodanish and Gray (1993) which considers the mid- and upper-level zonal winds at a distance and direction relative to the tropical cyclone center. Analysis of the mean u-component of the wind at mid-levels for 30 tropical cyclones has yielded encouraging results for thresholding wind values that relate to probability of recurvature (Fig. 2).
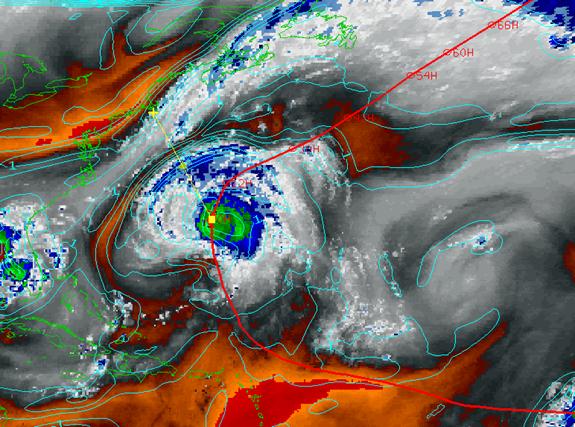
Fig. 1: Tropical cyclone Fabian at 17:45 UTC 5 September 2003 just prior to recurvature. The contours are the gradient of a specified range of brightness temperatures from the water vapor imagery, while the yellow line shows the distance between the gradient associated with the curved moisture boundary and the cyclone center.
Fig. 2. 350-500 mb u component of the wind (m s-1) averaged west,northwest, and north octants at 6 degrees from the tropical cyclone center between -24 and +12 hours from the time of recurvature. Values of u are averaged from 30 tropical cyclones that recurved.
(D. Bikos)
Eric Wendoloski, a NOAA Hollings Scholar from Millersville University in Pennsylvania, visited CIRA during the summer of 2012. During his nine week visit he performed a study of lightning activity and tropical cyclone formation. His results showed significant differences between lightning strikes around developing and non-developing tropical disturbances. During this quarter, work was done to assist Eric on the oral presentation submitted to the annual AMS meeting held in January 2013 in Austin, TX. The title of the talk is “Lightning Observations and Tropical Cyclogenesis.” M. DeMaria of RAMMB and J. Dostalek of CIRA are co-authors. (J. Dostalek, M. DeMaria)
A database of total precipitable water (TPW) as measured from the AMSU (Advanced Microwave Sounding Unit) instrument is being created for Atlantic tropical cyclones from 1995 to the present. The images coincide to the 6-hourly best track positions as determined by the National Hurricane Center. The data will be used to develop a remotely-sensed estimate of tropical cyclone size by examining the radial gradient of TPW. A similar dataset will also be created for East Pacific tropical cyclones. An example image from Hurricane Isabel on September 11, 2003 at 1800 UTC is given below. At this time it was located at 21.5°N and 54.8°W and was a Category-5 hurricane with 145 kt winds and a minimum central pressure of 915 mb. (J. Dostalek)
Figure 1. Total precipitable water (TPW) observed from AMSU for Hurricane Isabel on September 11, 2003 at 1800 UTC. The units of the TPW are mm and the x- and y-axes are labeled in km from the center of the storm.
As part of the CIRA Cal/Val project, microwave-based satellite retrievals, the associated GFS analyses, and dropsonde profiles are being collected and processed to be used in a validation study pertaining to the analysis of tropical cyclones. To be compared are two retrieval schemes, the statistical technique which is currently being used in CIRA’s wind retrieval system, and the Microwave Integrated Retrieval System (MIRS), NESDIS operational microwave retrieval method. Temperature (and moisture for MIRS) retrievals will be used in CIRA’s wind retrieval system, with the resultant winds being compared to collocated dropsondes. It is expected that the MIRS retrievals will produce more accurate results, but if issues with the MIRS soundings arise, suggestions to the MIRS development team will be made to improve the retrieval system. In addition, the two retrieval schemes will be used as input to programs that estimate maximum potential intensity (MPI) from a theoretical relationship derived by Kerry Emanuel and the vertical velocity profile of an air parcel from an entraining plume model. The code is being written such that it may be used in a real-time as well as in a case study mode. The coding for processing the statistical retrievals and for comparing them to collocated dropsondes is complete. Figure 2 shows an example of a NOAA-15 AMSU MIRS retrieval of temperature and a collocated dropsonde released from the Gulfstream IV during Tropical Storm Isaac of 2012. (J. Dostalek)
Figure 2. AMSU MIRS retrieval from NOAA-15 collocated with a dropsonde released from the Gulfstream IV aircraft during Tropical Storm Isaac. The red line is the MIRS temperature profile and the blue line is the dropsonde temperature profile. The time, latitude, and longitude are for the dropsonde. The satellite profile was retrieved 30 minutes earlier and 24 km away.
Updated software was provided to Alison Krautkramer of the National Hurricane Center. The program reads AMSU brightness temperatures stored in BUFR format. The brightness temperatures stored in the files are used to generate vertical temperature profiles which are then used in the study of tropical cyclones. (J. Dostalek)
Significant progress has been made in improving the software developed to generate automated surface wind analyses that combine the satellite-based MTCSWA (Knaff et al. 2011) with real-time hurricane aircraft reconnaissance. The software was developed for the Joint Hurricane Testbed and the previous version of the software ran during the 2012 hurricane season. Many issues with automated quality control, data weighting, and filter weights have been improved. Analyses created for the last three seasons show that the method can create realistic analyses given the relatively sparse and variable aircraft data coverage. Examples of small (Rina 2011), large (Sandy 2012) and poorly sampled (Danielle 2010) cases that occurred in the last few seasons are shown below. A web page showing all the cases (2010-2012) is being prepared. (J. Knaff)
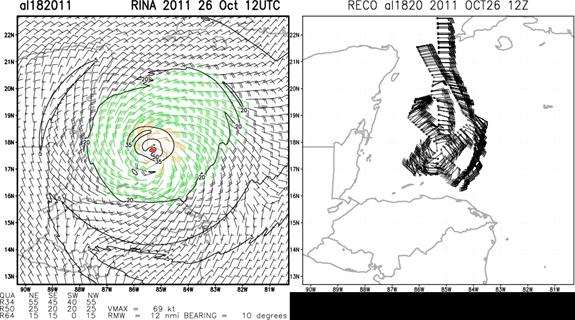
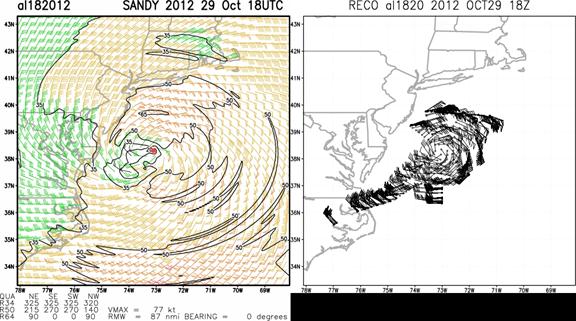
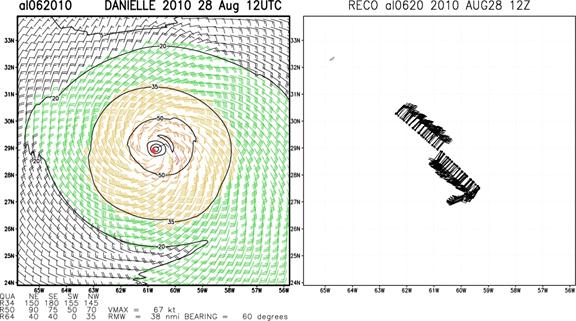
Caption: Examples of a combined aircraft + satellite surface wind analyses, left panel, produced using operational data collected during 2010-2012. Aircraft data, 6-hourly coverage shown in the right panel, comes from the HDOBS that are transmitted from the reconnaissance aircraft in real-time and include flight-level winds, and surface wind speed estimates from the stepped frequency microwave radiometer. Satellite information is provided from the Multi-platform Tropical Cyclone Surface Wind Analysis (MTCSWA), which is now (as of Sept 2011) an operation product.
![]()