

RAMM/CIRA 1st Quarter Report
![]()

![]()
Dataset Conversion: The entire NCEP/NCAR global reanalysis dataset (1948-present) has been acquired and is currently being converted from its native grib format to a packed ASCII format. This dataset will be used in tropical cyclone research. (J. Dostalek and J. Knaff)
Real-time Typhoon Intensity Forecasts: Ocean heat content information is being used to produce forecasts of typhoon intensity at the Naval Research Laboratory, Monterey. Real-time heat content information is provided to NRL by G. Goni of the NOAA/AOML. This information is used in a recently developed version of the Statistical Typhoon Intensity Prediction Scheme that makes use of such information in the western North Pacific. Forecasts are produced in real time and are disseminated to the Joint Typhoon Warning Center for use in their forecasting duties. Forecasts from the 2005 Typhoon season have been verified using the preliminary best track information and are presented in Table 1 along with the percent improvement over a control forecast constructed from climatology and persistence. These results suggest skillful forecast are made using this methodology through 72 hours, however, the number of degrees of cases is rather limited. (J. Knaff)
Table 1: Verification of tropical cyclone forecasts in the western North Pacific using a new version of STIPS that make use of ocean heat content information. The verification consists of 8 tropical cyclones (wp172005- wp242005).
|
12-h (146) |
24-h (133) |
36-h (121) |
48-h (109) |
72-h (84) |
96-h (41) |
120-h (25) |
Absolute Errors (kt) |
7.6 |
12.9 |
15.5 |
18.3 |
22.0 |
29.4 |
32.0
|
Percent improvement |
9.4 |
14.1 |
19.6 |
14.0 |
10.2 |
-7.4 |
-14.3 |
Tropical Cyclone Surface Wind Analysis: Work continues on a satellite only tropical cyclone surface wind analysis. This work combines in a specially developed analysis (cylindrical, variational) observations from feature tracked winds, SSMI winds, Quickscat winds, AMSU-derived 2-d wind fields, and IR-derived winds. The key ingredient is the recent development of an IR method to predict the winds associated with the core of the tropical cyclone using two pieces of information predicted from the IR imagery (size and radius of maximum winds) and other information provided from the tropical cyclone advisories (intensity, motion, and location). The combined analyses are run in real-time while the analysis is improved. The current version uses a standard flight-level to surface wind correction over water, and decreases (turns) these winds an additional 20% (20 degrees) over land. An example of wind analyses from Hurricane Epsilon (AL292005) at its peak intensity of 75 kt ( i.e., 12/4/2005 at 12 UTC) is shown in Figure 1. (J. Knaff)

Figure 1: Satellite-only surface wind analysis of Hurricane Epsilon on December 4, 2005 at 12 UTC. Wind radii are given at the bottom of the figure.
New Tropical Cyclone Pressure-Wind Relationship: The pressure vs. wind relationships of tropical cyclones have been re-evaluated using the last 15 years of tropical cyclone best track wind estimates and aircraft MSLP values to assess the relative importance of latitude, environmental pressure and tropical cyclone size. Both environmental pressure and tropical cyclone size are determined from numerical analyses and appear to have no dependency on the analysis used (NOGAPS, GFS, NCEP-Reanalysis). Findings suggest that all of these factors can be used to reduce the scatter in the current pressure wind relationships. Larger and higher latitude storms produce lower MSLP for the same maximum wind speed. Environmental pressure is additive, or in other words storms occurring in a higher pressure environment have higher MSLP. Relationships were developed to estimated the wind from quality pressure observations and to estimate the pressure given a good estimate of the maximum 10-m, 1-minute sustained wind. These relationships can be utilized in operational tropical cyclone centers throughout the world and for reanalysis of past tropical cyclone events. Maximum surface winds speeds estimated from aircraft pressures for the Atlantic and E. Pacific tropical cyclones in 2005 are compared with the preliminary best track intensities in Figure 2. The paper describing this algorithm has been submitted to Weather and Forecasting for publication. Furthermore, a conference paper discussing its application to historical tropical cyclone data in the western North Pacific has been submitted. (J. Knaff) Click on image to enlarge.
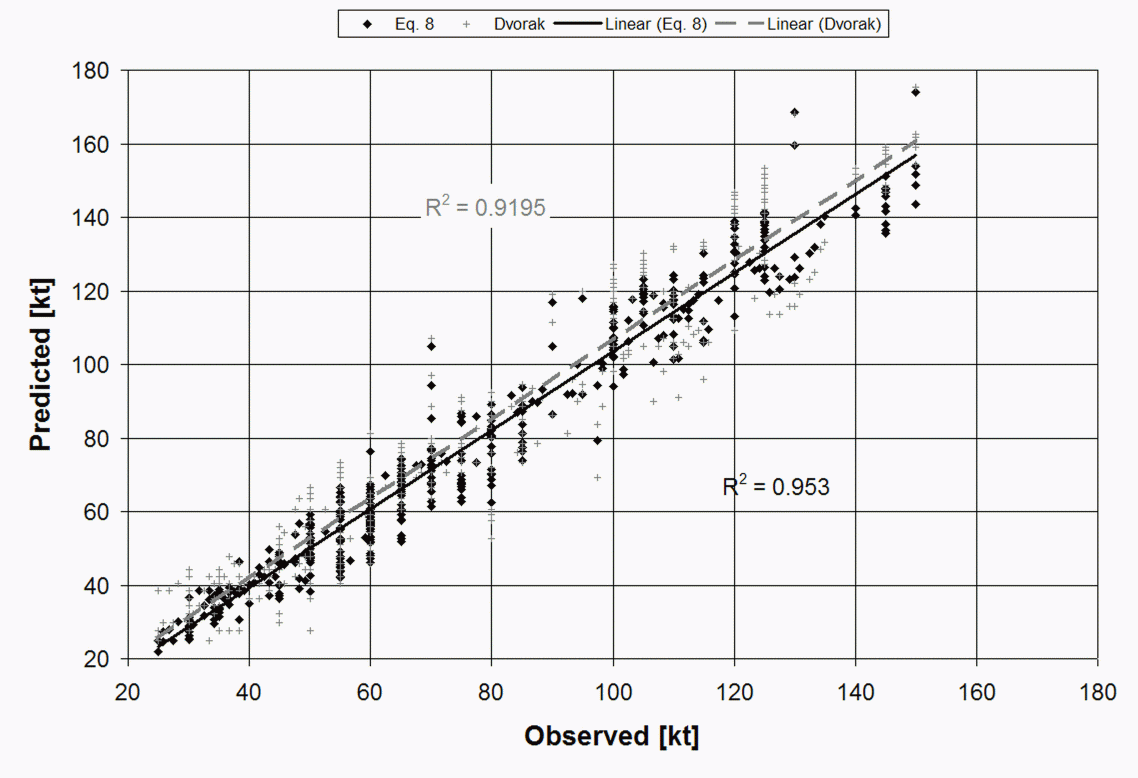
Figure 2: Scatter diagram of the independent predicted values of V max using aircraft pressures with this new methodology (equation 8) shown as black boxes and those predicted using the Dvorak pressure wind relationship (crosses) vs. observed values of V max from the operational best track .
Statistical Tropical Cyclone Wind Radii Paper Submitted: A paper describing the statistical tropical cyclone wind radii prediction schemes used at the National Hurricane Center and the DOD Joint Typhoon Warning Center has been submitted for publication. Two models based on climatology and the persistence of initial conditions are described. One model makes use of parametric vortex to make predictions while the other uses multiple linear regressions. Both produce remarkably similar results. See previous quarterly reports for examples. (J. Knaff)
Bias Corrections for IR Wind Radii Estimates: Using an IR-based algorithm to estimate tropical cyclone wind structure the probability density distributions of estimated tropical cyclone wind radii (i.e., 34-kt, 50-kt, and 64-kt) were examined and compared to operational estimates with and without aircraft reconnaissance data as input. The cumulative probability distributions resulted in the discovery of biases in our algorithm. Estimates of the 50-kt and 34-kt wind radii from the algorithm tended to be too large (small) for category 3,4 and 5 hurricanes (i.e., maximum winds greater than 95 kt) (tropical storms). Fortunately, the biases are related to the intensity and. As may have been anticipated, it was also noticed that there is a distinct influence of aircraft reconnaissance on the advisory estimates of wind radii, emphasizing the need for such data in operations and for research. Systematic biases have since been corrected for.
Hurricane Genesis Web Page: The Atlantic/East Pacific Hurricane Genesis Web Page was ported over to the new RAMM Team’s web server. It is currently being tested and eventually, it will become a backup web page to the operational web site at ORA. (H. Gosden)
Tropical Cyclone Genesis Algorithm Extended: Collection and cataloging of large-scale, western North Pacific GOES-9 water vapor imagery was conducted for a project to extend a tropical cyclone genesis algorithm to the NWS Pacific region. Roughly 1.5 years of continuous data were found to exist in our archives. These will be intercalibrated with MTSAT water vapor imagery as part of this project. (J. Knaff)
Global and Fully Automated Data Collection: Several research data sets from the 2005 Atlantic hurricane season were collected at RAMM/CIRA. 1) Tropical Cyclone IR archive: The data collection is now global and fully automated. All images are viewed for quality control. Since May 15, 2005, IR images with 64 tropical cyclones were archived. Of these, there were 13 Atlantic hurricanes, seven eastern Pacific hurricanes, and 14 western Pacific typhoons. 2) Tropical RAMSDIS Archive: The image files displayed on Tropical RAMSDIS were archived for the period 26 June to 31 October. Until mid-August most of the images were included, and following that time all of the image products were saved. 3) GOES special rapid interval data sets: With several Atlantic hurricanes full resolution multi-channel sectorized rapid scan images were archived. Most of these were RSO (Rapid Scan Operations, 8 images/ hour), but there were also 2 short periods of SRSO (Super Rapid Scan Operations, 22 images/ hour). GOES-11 rapid scan was collected with Hurricane Emily. GOES-12 data sets were archived with major hurricanes Dennis, Emily, Katrina, Rita, and Wilma. Additional GOES data sets are also available from the CIRA archive. 4) MODIS/AVHRR: An archive of 1 km resolution Mercator IR remapped images was initiated and along with a few 250-meter resolution visible MODIS images, includes approximately 100 images. (R. Zehr, J. Knaff)
Objective Dvorak Technique Intensity Estimates:Intensity estimates using the Objective Dvorak Technique (ODT) have been computed for the seven 2005 Atlantic hurricanes that attained at least Saffir-Simpson Category 3. Aircraft observations of the lowest central pressure with the three Category 5 hurricanes (Katrina, Rita, and Wilma) indicated intensities exceeding Mitch (1995) and not observed since Gilbert in 1988. The lowest minimum sea-level pressures were: Katrina, 902 hPa; Rita, 897 hPa; and Wilma, 882 hPa. The highest maximum wind assigned to each of them by the Tropical Prediction Center Advisories was 150 knots. Comparable results with the RAMM/CIRA version of ODT using a 6-hour running average of computations on 30-minute interval images, gave maximum intensities of: Katrina, T7.2 (146 kt, 915 hPa); Rita, T7.3 (149 kt, 911 hPa), and Wilma, T7.6 (158 kt, 903 hPa). (R. Zehr)
![]()