

RAMM/CIRA 1st Quarter Report
![]()

![]()
New Software for Thee-Color AREA File Generation: Software has been developed to create McIDAS-formatted AREA files from three-color imagery, such as generated by the McIDAS Combine command. The Combine command creates a 24-bit three-color product that can be turned into a JPG image, but not directly into a McIDAS-formatted AREA file, nor converted into a 1-byte (8-bit) image. The new software uses an algorithm coded by Stan Kidder, which is based on Heckbert’s Median Cut Algorithm from 1982, to create a 1-byte AREA that can be displayed in a McIDAS frame and looped over multiple frames. The program creates a unique color table for each three-color image. That color table needs to be applied to the image to have the three-color effect. This software is currently being tested on Meteosat Second Generation (MSG) data to produce three-color images and loops. An example of the new algorithm applied to MODIS data is included in the following pair of figures. (D. Hillger, S. Kidder)
Figure 1a: An image created from an AREA file generated using the new thee-color software. This example is the “natural” color product as applied to MODIS data, consisting of the 1.6 µm, 0.8 µm, and 0.6 µm bands for the red, green, and blue bands, respectively.
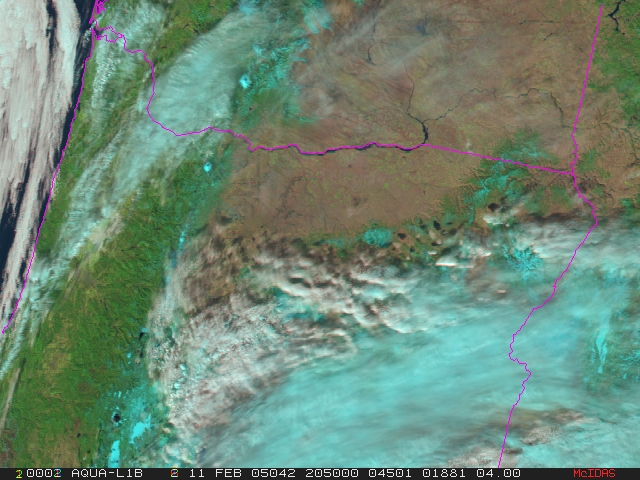
Figure 1b: For reference, an image created from output of the McIDAS Combine command, for the same data as in Figure 1a. The casual viewer would have a hard time noting differences between the two images.
Three-Color AREA File Loops: The software developed to create McIDAS-formatted AREA files from three-color imagery, is now being used to create re-loadable image loops within McIDAS. Since the program optimally creates a color table unique to each three-color image, that color table needs to be appropriately named and applied to its intended image to have the proper three-color effect. This problem was worked out with appropriate software and is now being applied to Meteosat Second Generation (MSG) data to produce three-color loops. An example of a three-color MSG loop is attached below. (D. Hillger)
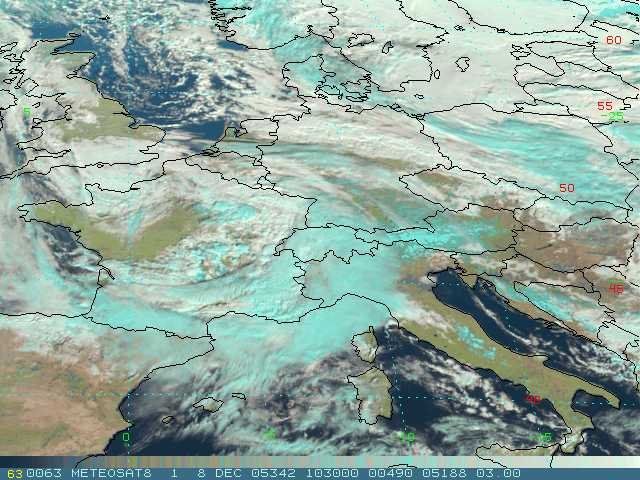
Figure 1: An image loop created from McIDAS AREA files generated using new thee-color software. This example is the MSG “natural” color product over Europe, consisting of the 1.6 µm, 0.8 µm, and 0.6 µm bands for the red, green, and blue colors, respectively. High/cirrus clouds and snow-covered ground are cyan, low clouds are white, and bare ground surfaces are natural colors (green and brown). [Click on the image to start the loop.]
Satellite Climatology: The processing of the large sector U.S. climatologies continues. Products completed include monthly large sector composites for September and October 2005. Processing is slightly behind schedule, but should be caught up during the holidays.
The processing of wind regime products continues. Monthly wind regime composites from both channel 1 and channel 4 for August and September 2005 have been completed. Combined monthly products have also been completed for these months and channels.
Work on the new cloud climatology project with Eureka, CA has been started. New procedures have been set up, and data from our archives for July-August time period are currently being processed. (C. Combs)
Wind Retrieval Technique Development: Using a method originally developed for use with tropical cyclones, a wind retrieval technique using vertical temperature profiles derived from radiances from the Advanced Microwave Sounding Unit (AMSU) is being developed for the polar regions. With a boundary condition given by a 100-hPa height field from the Global Forecast System (GFS) analysis, the temperature profiles are used in the downward integration of the hydrostatic equation to compute height as a function of pressure. A balance condition is then applied to compute the stream function, from which the u- and v-component of the non-divergent wind can be evaluated. Figure 1 shows the 500-hPa height field and the geostrophic winds as calculated using the technique applied to AMSU data from 0015 UTC 17 December 2004. For comparison, the 0000 UTC 17 December 2004 500-hPa heights and geostrophic winds from the GFS analysis are also given (Figure 2). The retrieval technique captures the overall pattern quite well, although there is a negative height bias of 28 m. Future work will include using a nonlinear balance equation to derive the stream function, as well as validation against collocated radiosonde data. (J. Dostalek and Mark DeMaria) Click on images to enlarge.
Figure 1. Derived 500-hPa heights and geostrophic winds for 0015 UTC 17 December 2004.
Figure 2. GFS analysis of 500-hPa heights and geostrophic winds for 0000 UTC 17 December 2004.
Midlatitude Cyclones Study: The processing of various datasets for use in the study of midlatitude cyclones has begun. NCEP/NCAR global reanalysis and North American Regional Reanalysis data will be used to identify atmospheric rivers and trowals. The output from these datasets will be compared to satellite imagery for several cases to investigate the ability of the satellite imagery to analyze and forecast these features of midlatitude cyclones. (J. Dostalek)
Severe Weather Nowcasting Product: Work continues in the development of a severe weather nowcasting product which makes use of GOES storm-top 3.9 µm albedo measurements. This future product will follow from recent research which has been submitted to Mon. Wea. Review for publication (see below). Cloud reflectivity has been shown to vary with cloud depth and updraft strength, so this product will allow thunderstorms with relatively strong updrafts to be identified and monitored with GOES. (D. Lindsey)
MCS Prediction Index: Work has begun on the development of a Mesoscale Convective System (MCS) prediction index. This is a collaborative project with Israel Jirak, a joint post-doc in the Atmospheric Science department and CIRA at Colorado State University. GOES IR data will be used along with a statistical algorithm to identify areas in which MCS formation is likely. (D. Lindsey)
Broadband Cloud-Top Reflectivity: A short study was completed to assess whether thunderstorm-top 3.9 µm albedo measurements show similar characteristics to broadband albedo as measured from the CERES instrument. The figure below shows that no relationship exists between them. This is not a surprise: the majority of solar radiation occurs at shorter wavelengths than 3.9 µm, and visible albedo depends mostly on optical depth. (D. Lindsey) Click on image to enlarge.

Values of CERES cloud albedo plotted against GOES 3.9 µm albedo of optically thick ice clouds over the U.S. during the summer of 2004.
![]()